Name:
Class:
Date:
chapter 16
Answer Key

Name:
Class:
Date:
chapter 16
26. c
27. c
28. a
29. c
30. c
31. d
32. d
33. b
34. a
35. b
36. c
37. d
38. d
39. d
40. e
41. d
42. a
43. a
44. e
45. c
46. c
47. e
48. b
49. b
50. c
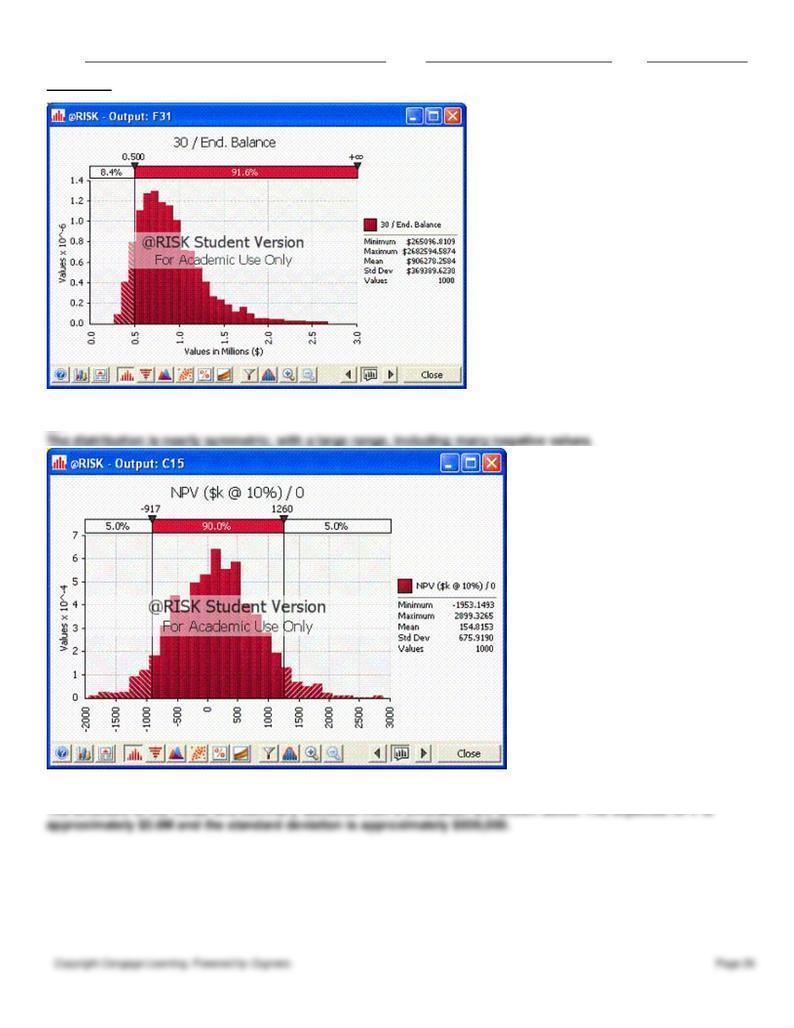
51. The standard deviation has dropped considerably, to about $370,000, and the distribution is not nearly as
chapter 16
skewed. The reduction is expected value is clearly offset by an accompanying reduction in risk.
52.
53.
54. It might not match our intuition, based on the answer to Question 71. However, we must simulate to find the
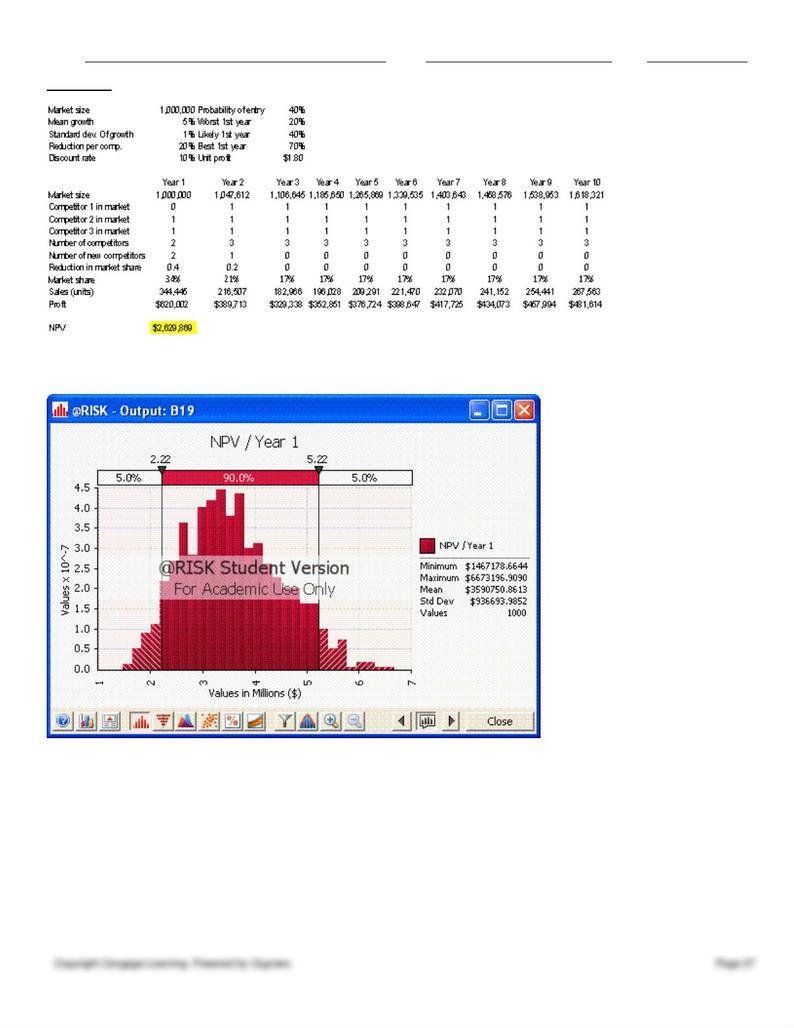
55. We are given a mean and standard deviation, which means market growth rate is normally distributed.
56.
chapter 16
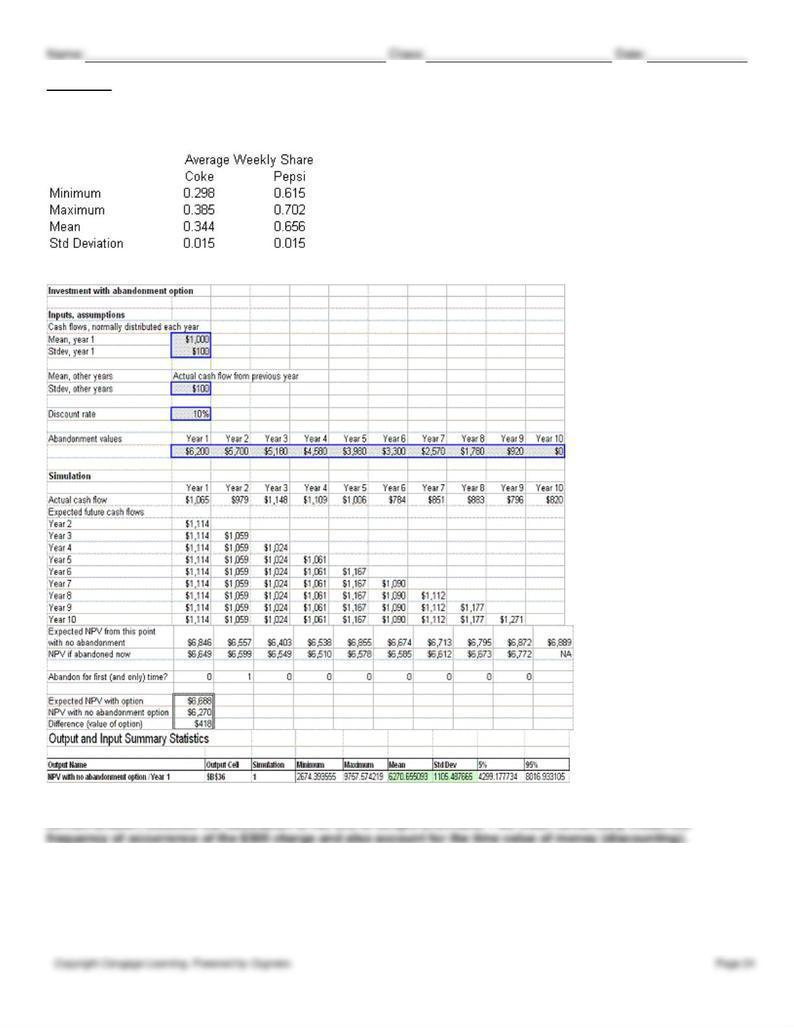
The change is clearly worth the cost.
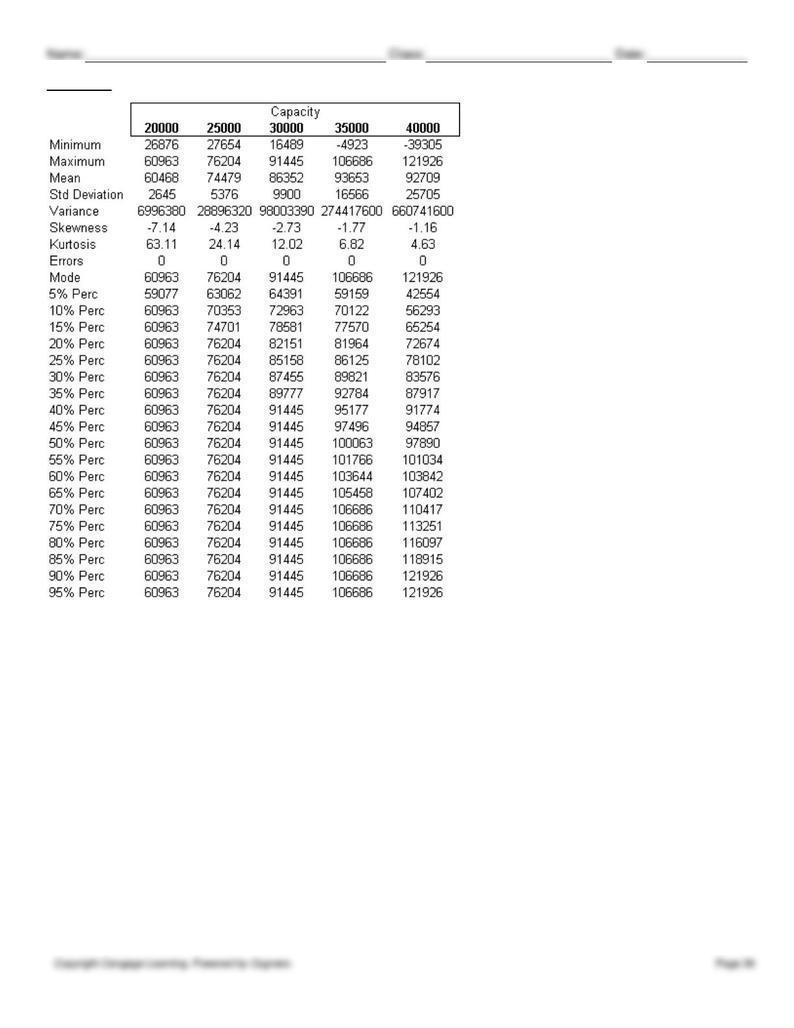
59. Yes. Both simulations 4 and 5 (Q=35,000 units and Q=40,000 units) have a minimum that is negative, so there is at
least some chance of getting a negative number with these alternatives (although the smallest percentile, 5th percentile,
60.
The output plot now shows a mean of approximately $900,000.
Name:
Class:
Date:
chapter 16
62.
Name:
Class:
Date:
chapter 16
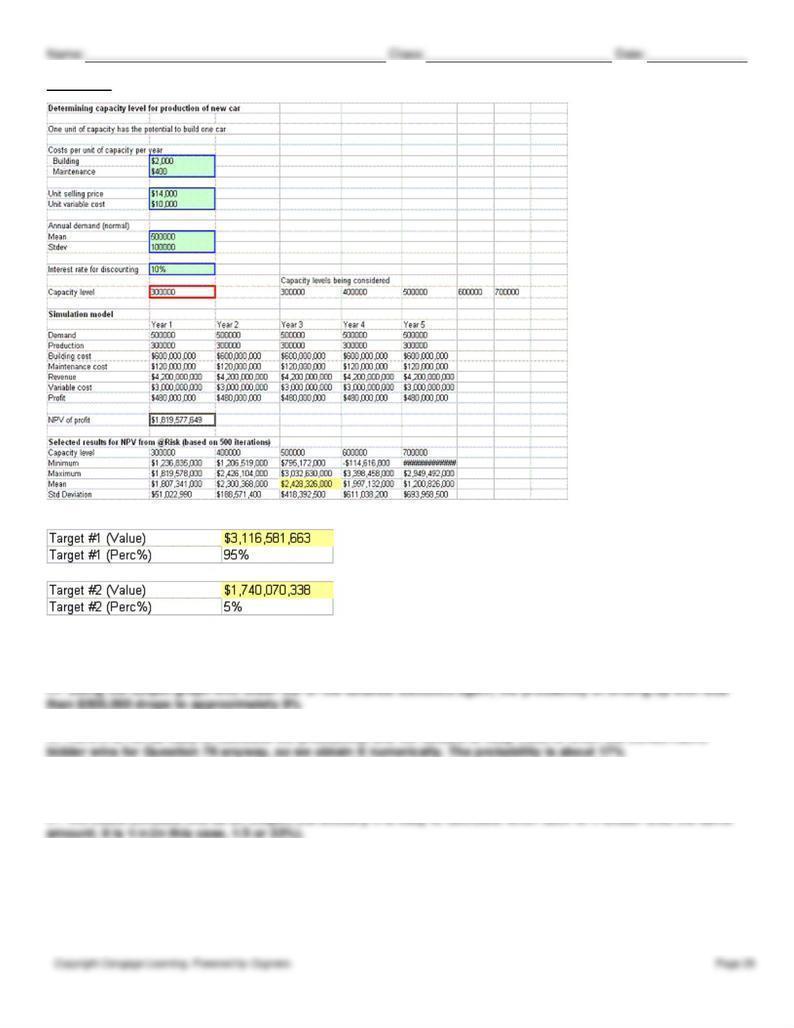
63. (A)
chapter 16
It appears that a capacity level of 500,000 achieves the largest mean NPV.
(B)
(C)
(D)
From the above @Risk output, it is clear that the variance (or standard deviation) increases with larger capacity levels.
Because a risk-averse person doesn't like large variance, the optimal capacity level would probably decrease.
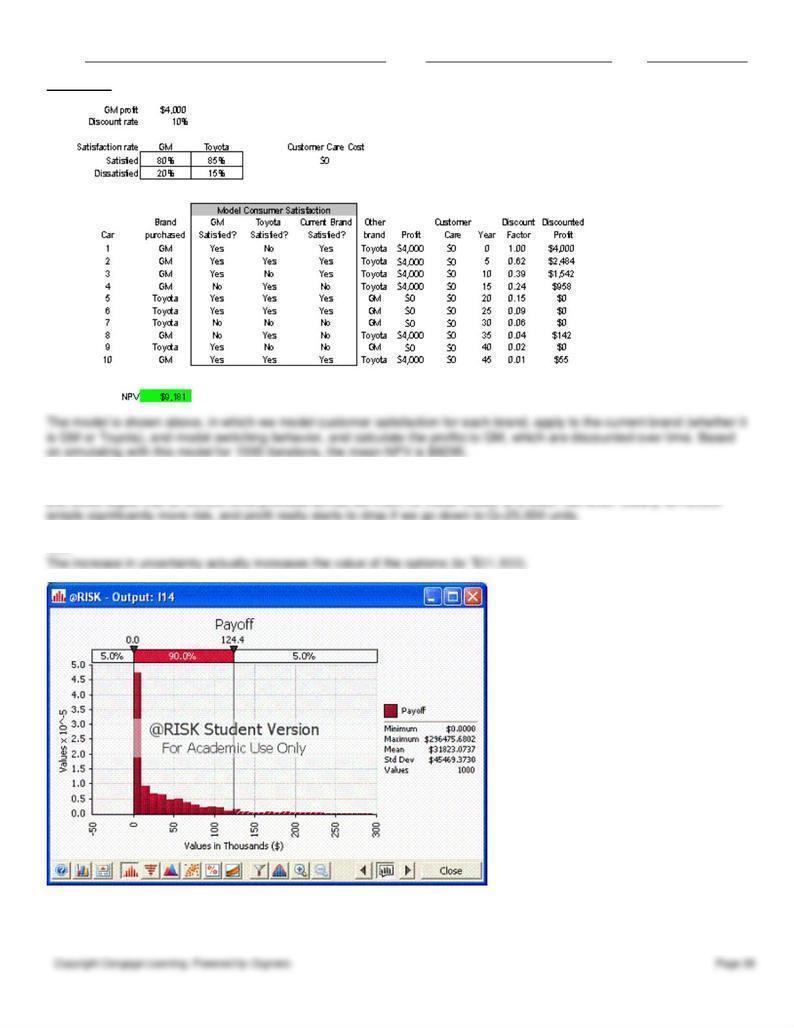
66. Raising customer satisfaction to 90% translates to an NPV of $9270.
68.
chapter 16
69. Raising customer satisfaction to 85%, at a cost of $300 per customer, translates to an NPV of $8150. Since
71.
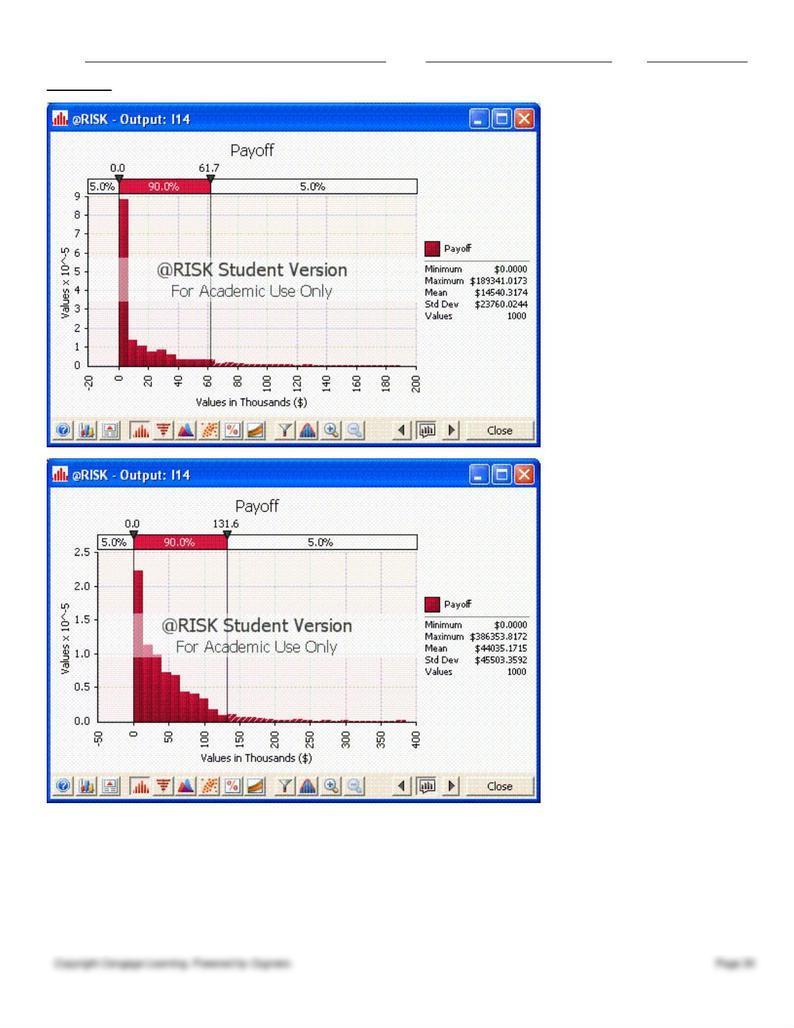
In the first case the value drops to $14,500 and in the second it increases to $44,000.
Name:
Class:
Date:
chapter 16
72. The standard deviation of Simulation 5 (Q=40000) is the largest, so it has the most “spread or dispersion”.
73.
75.
76.
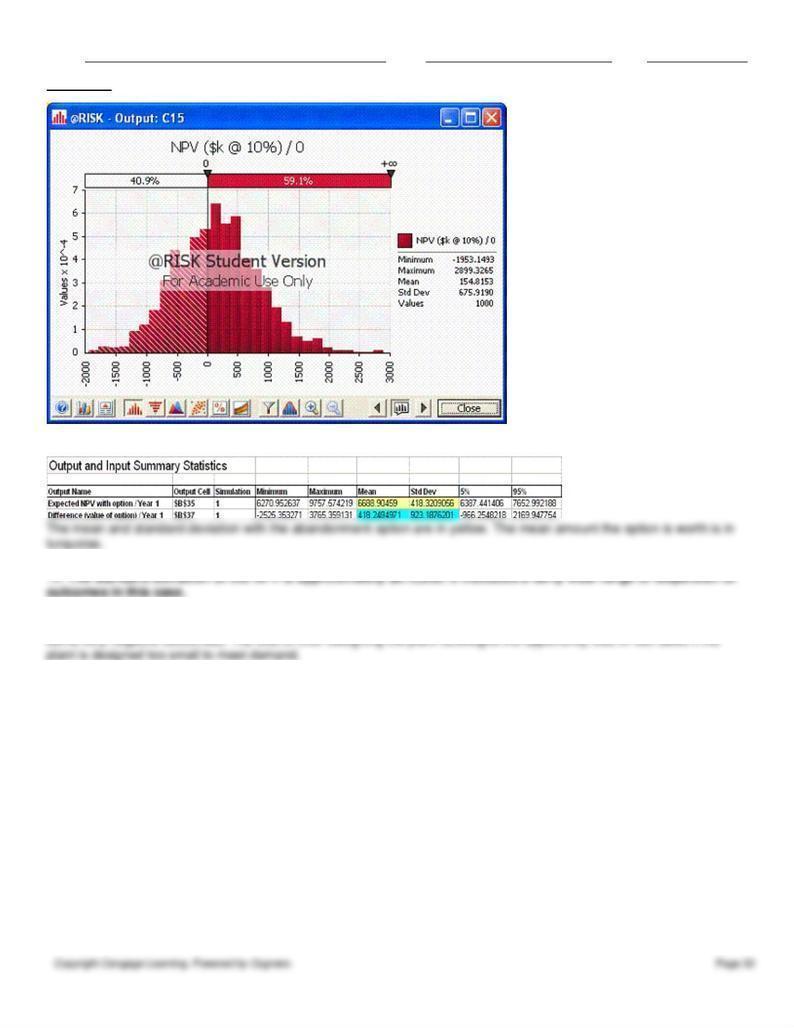
The output graph below indicates about a 41% chance of a NPV below zero.
Name:
Class:
Date:
chapter 16
77.
79. We can see from the plot in the answer to Question 78 that the NPV distribution is skewed to the left (i.e., includes
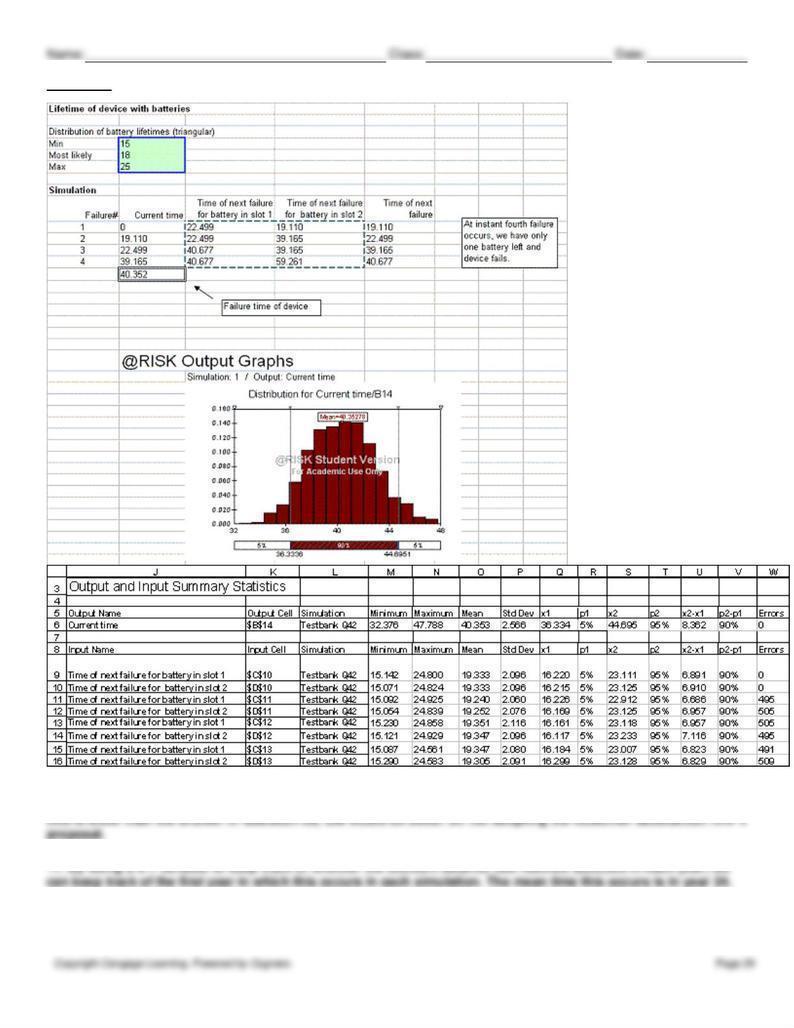
80. The mean time in this case this occurs is in year 25, only a slight increase from before.
81.
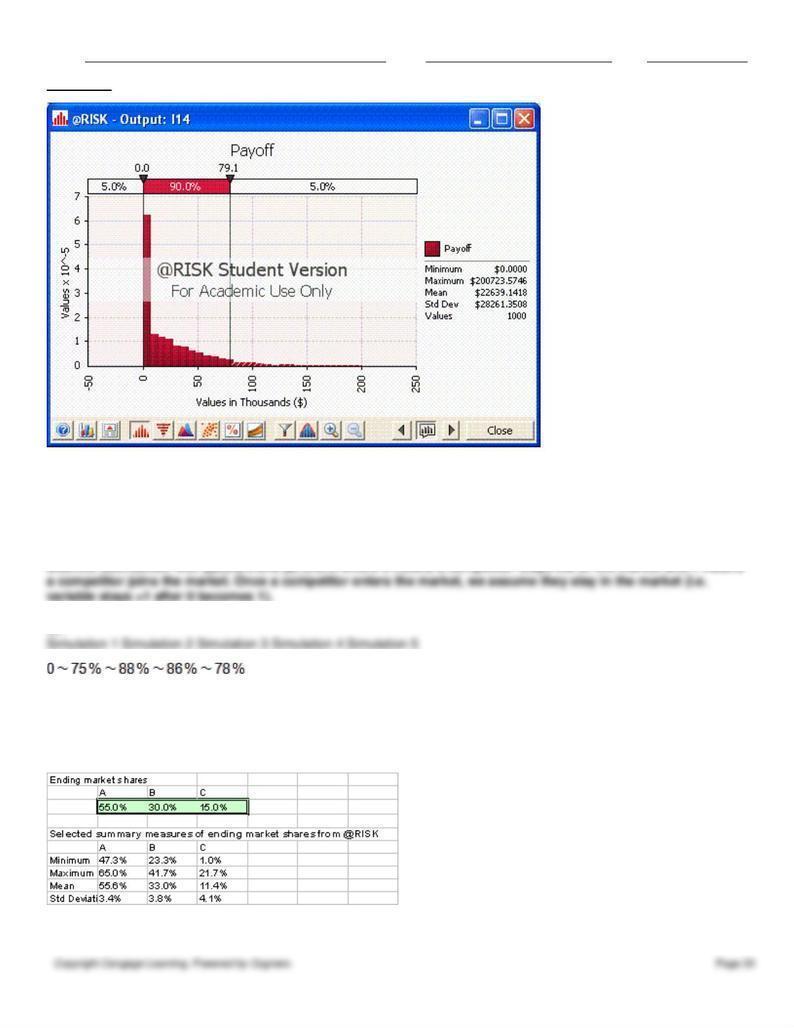
The mean discounted value of the options is approximately $22,600.
Name:
Class:
Date:
chapter 16
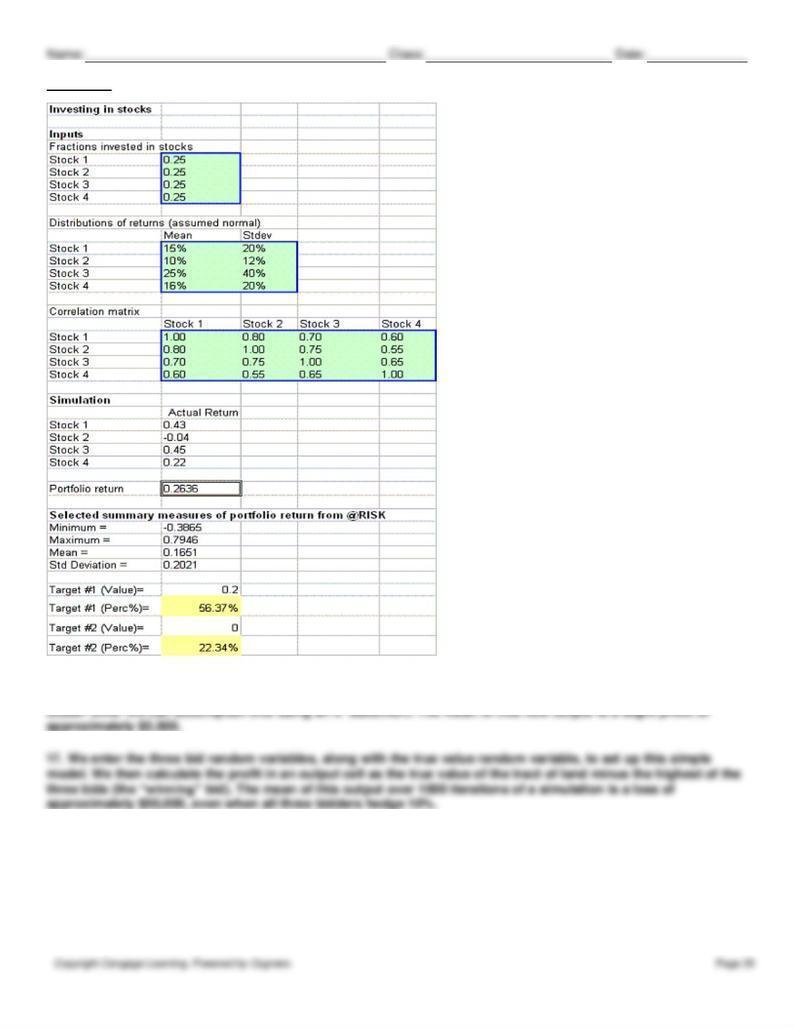
82. There is a 22.34% chance of a negative return
83. The extra 5% customer satisfaction translates to an NPV of $8770.
84. In each period where a competitor has not yet entered the market, we can model competitor entry with a 0-1
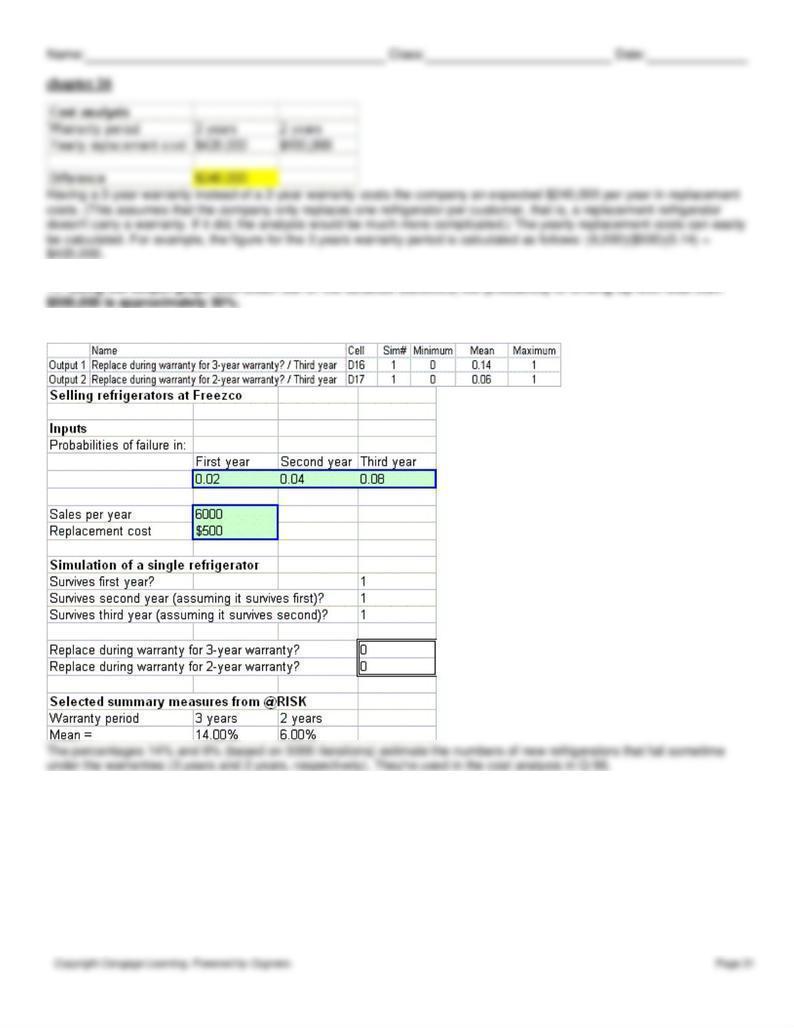
86. It appears that an extra 5% is worth approximately $500 to GM (based on $9270-$8770, and $8770-$8295)
87.
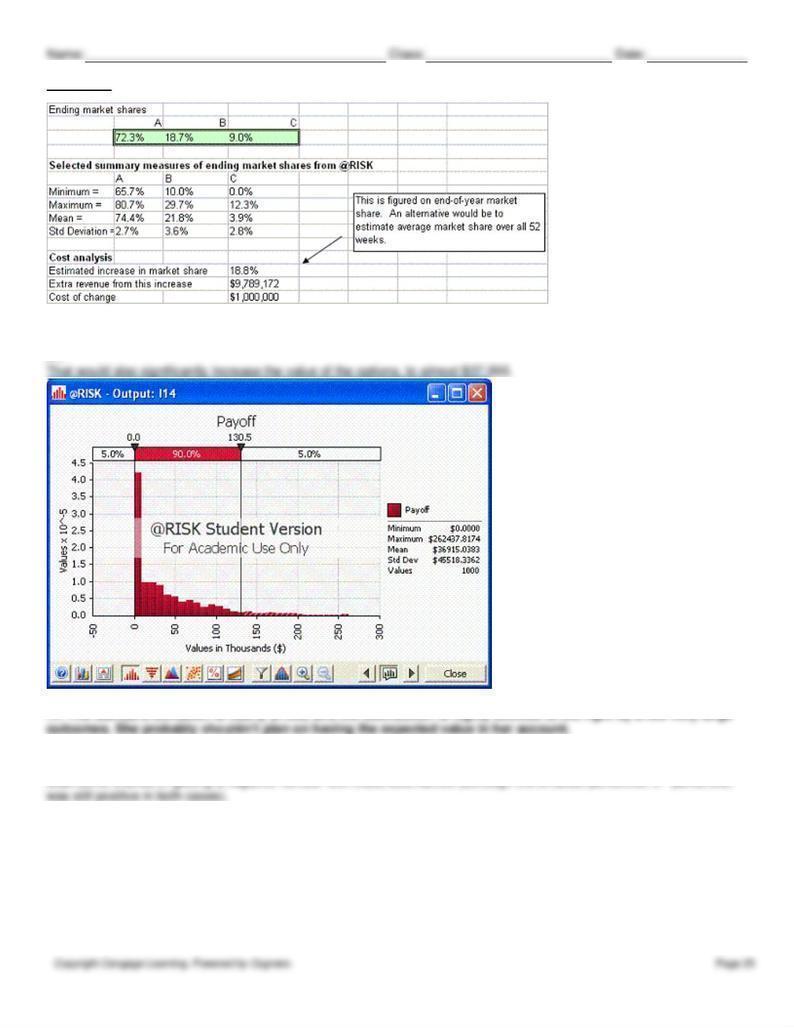
Clearly, on average, brand A ends up with the largest market share by far.
chapter 16
88. Simulation 4 (Q=35,000 units) has a median (50th percentile) of $100,063 which is the largest value.
89. We are given a minimum, maximum and most likely value, which indicates a triangular distribution.
91.
(A)
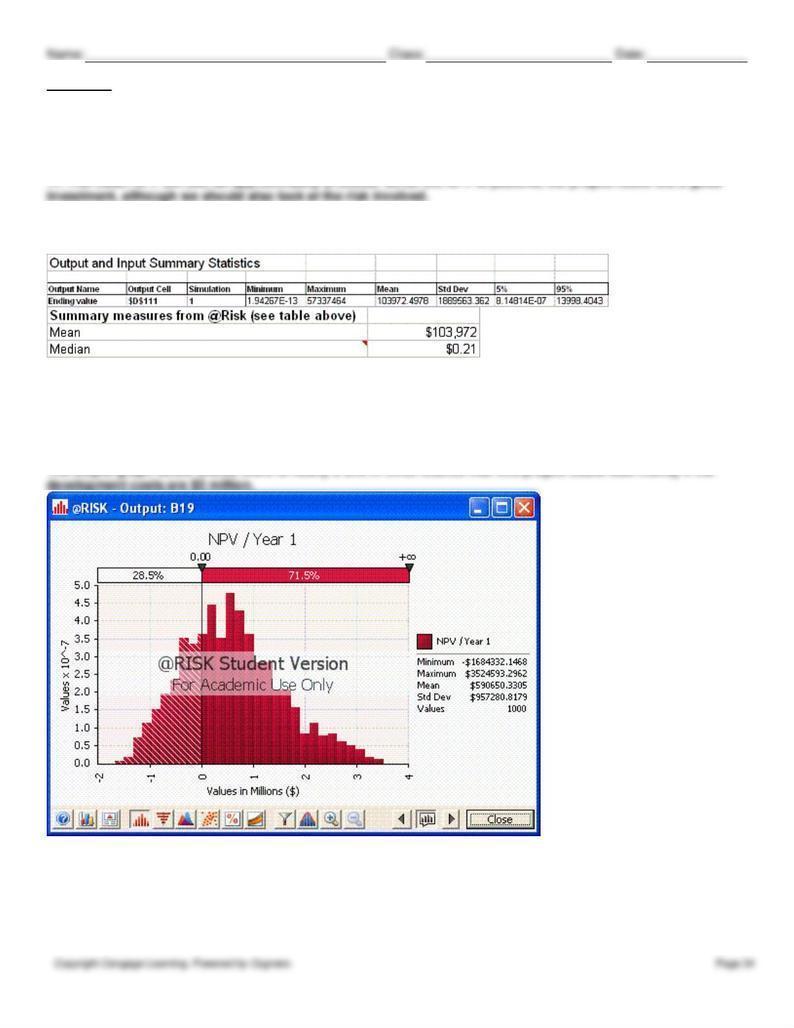
Note that the median is obtained from @RISK Detailed Statistics window.
(B)
The ending value after 100 years is approximately “zero” a large fraction of the time -- hence the median is approximately
0 -- but the mean is fairly large because of the occasional times where the ending value is really large.
92.
93.
chapter 16
Since there is a 56.4% chance of being less than 0.2, then there is a 43.6% chance of exceeding 0.2
94. We calculate the profit in an output cell the same way as before, except now only when the conservative
96.
chapter 16
Simulation 4 (Q=35,000 units) yields the largest mean NPV of $93,653.
97. Including the required investment of $0.9 million, the resulting NPV is $155,000.
98.
The output below shows an expected NPV of $49,474.

Name:
Class:
Date:
chapter 16
100. Although this project has a positive NPV, there is also substantial risk involved. A firm with a relatively low
tolerance for risk may indeed decide not to pursue this project.
Name:
Class:
Date:
chapter 16
101.
102. The plant should be built for a capacity of 35,000 units. This provides the highest mean and median NPV, although
104. The random variable inputs are the market size growth rate in each year, the initial market size, and the
competitor entry time for each of the three potential competitors. The output is the project NPV.

Name:
Class:
Date:
chapter 16