Name:
Class:
Date:
chapter 6
Answer Key

Name:
Class:
Date:
chapter 6
29. a
30. b
31. b
32. c
33. b
34. d
35. c
36. d
37. a
38. e
39. d
40. a
41. d
42. a
43. b
44. d
45. d
46. a
47. a
48. e
49. b
50. b
51. e
chapter 6
52. c
53. c
54. a
55. (A)
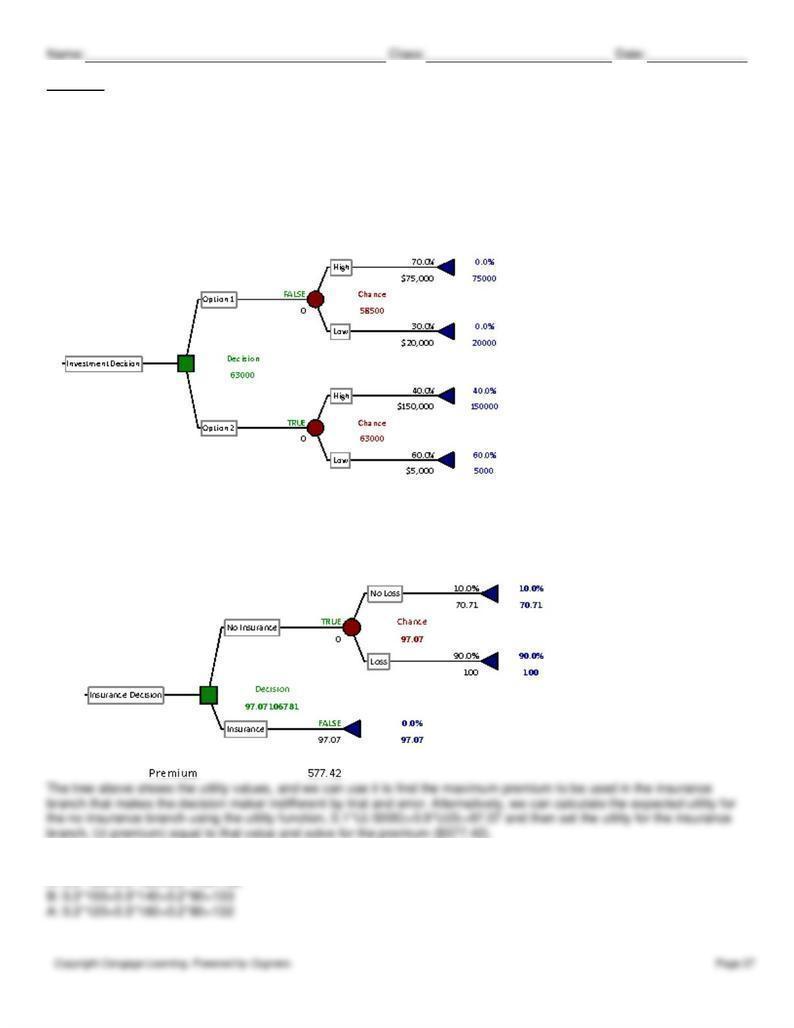
(B) The decision tree shows the second option is better because it provides a slightly higher EMV ($63,000 vs. $58,500).
(C) The optimal decision would change to the first option, because its certainty equivalent is higher ($52,694 vs.
$32,182).
56.
57.
Name:
Class:
Date:
chapter 6
58.
59.
61. If the insurance premium were to increase much above $175, Mrs. Rich would be better off not purchasing the

Name:
Class:
Date:
chapter 6
63.
64.
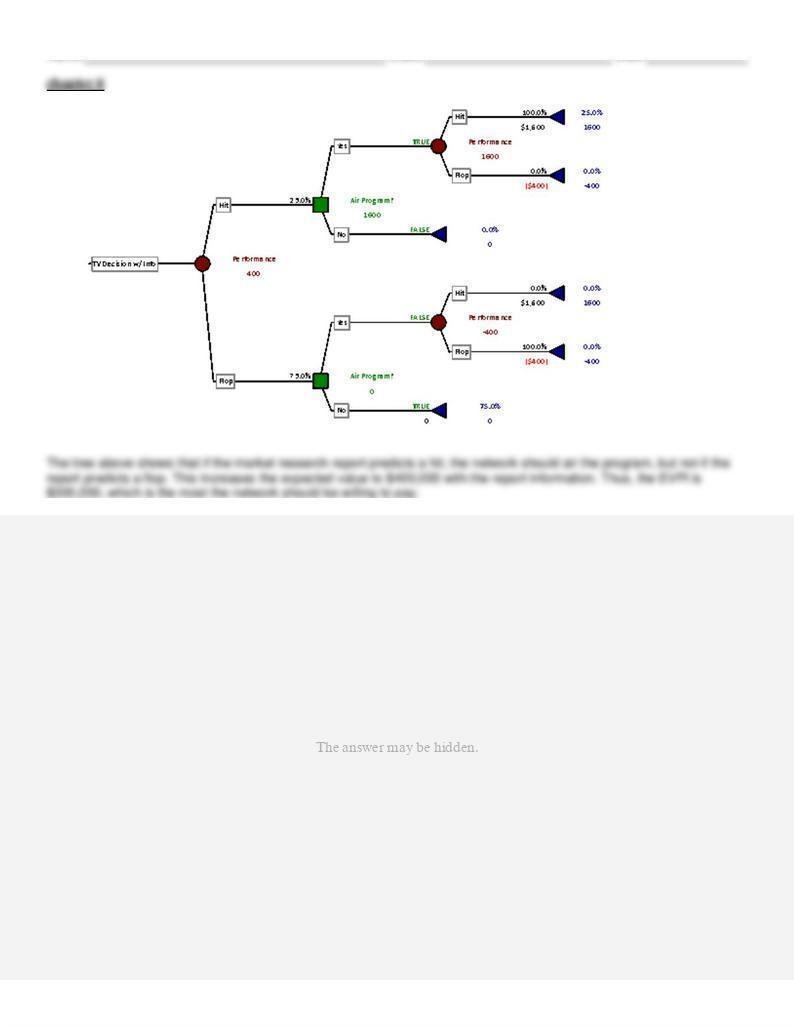
65. The tree above shows that the best alternative is to air the program. The EMV of this option is $100,000.
66.
chapter 6
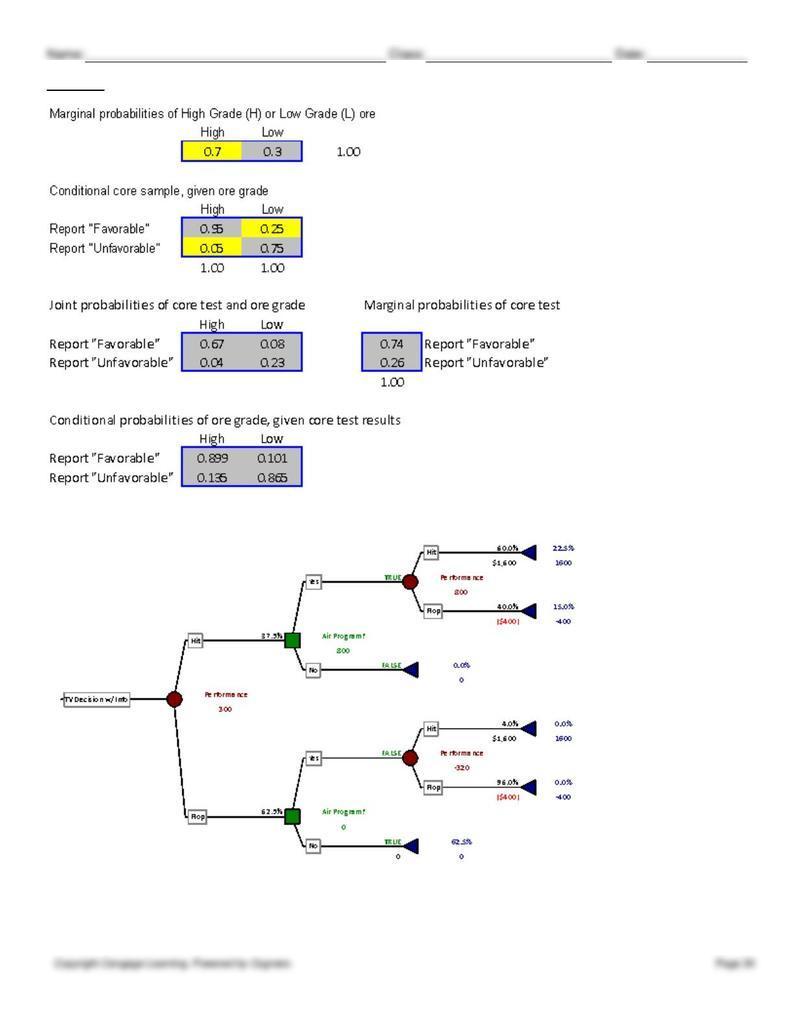
67.
The tree above shows that the market report is still fairly valuable, even in the imperfect case. The information increases
the expected value to $300,000, thus, the EVSI is $200,000 ($300,000-$100,000). Therefore, the network would be
justified in purchasing the report for $160,000.
68.
69.
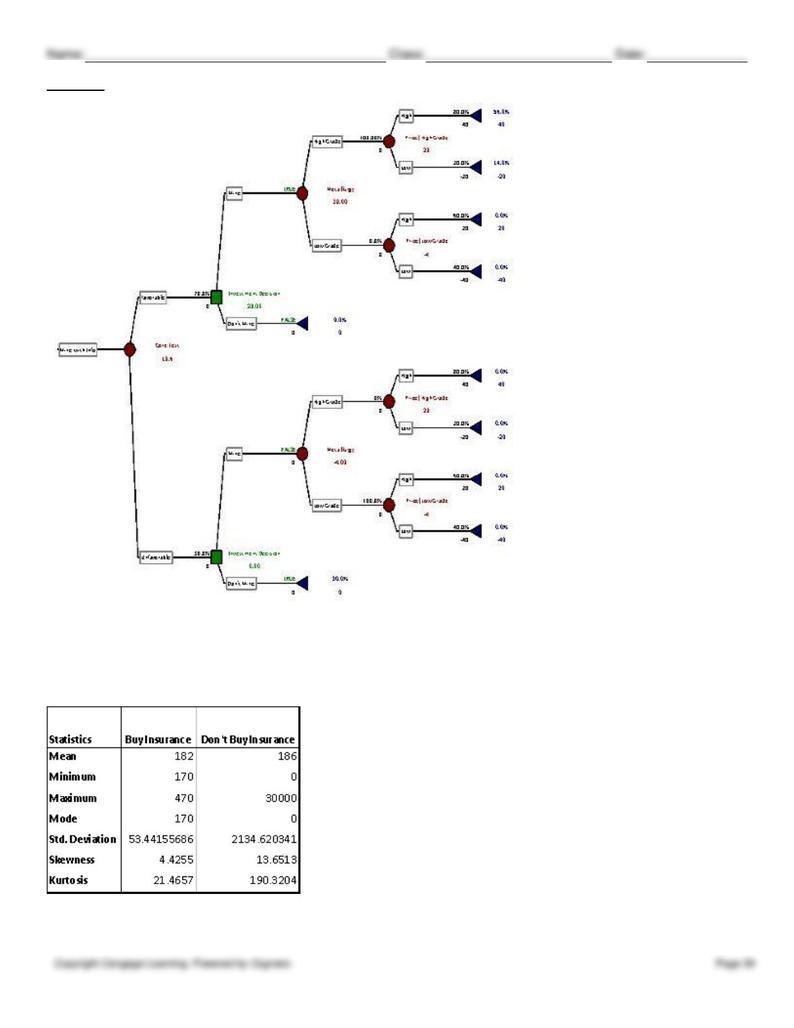
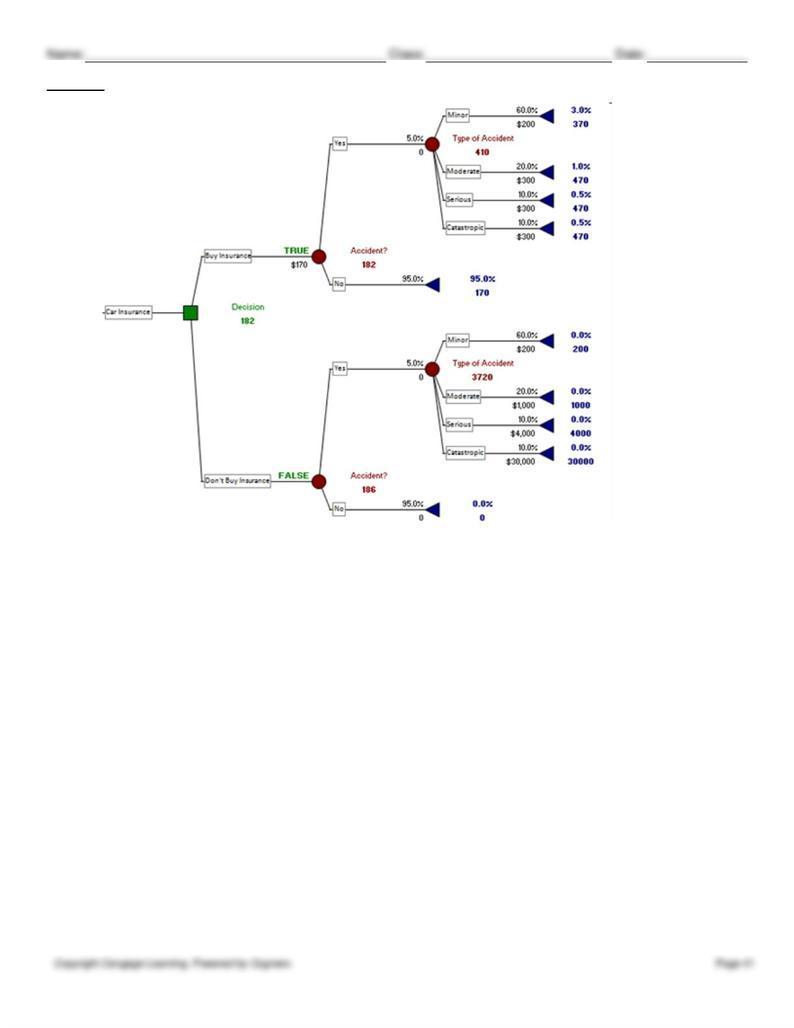
70. The tree above shows that the best alternative is to purchase the insurance. Her expected cost in that case is $182.
71.
Probability of being in an accident
0.05
Collision Insurance Premium
$170
Name:
Class:
Date:
chapter 6
Deductible Amount
$300
Payoff Table
No
Minor
Moderate
Serious
Catastrophic
Accident
Accident
Accident
Accident
Accident
Purchase Collision Insurance
$170
$370
$470
$470
$470
Do Not Purchase Collision Insurance
$0
$200
$1,000
$4,000
$30,000
Probability
0.95
0.03
0.01
0.005
0.005
72. Risk should be considered, through an examination of the risk profile of alternatives.
73.
chapter 6
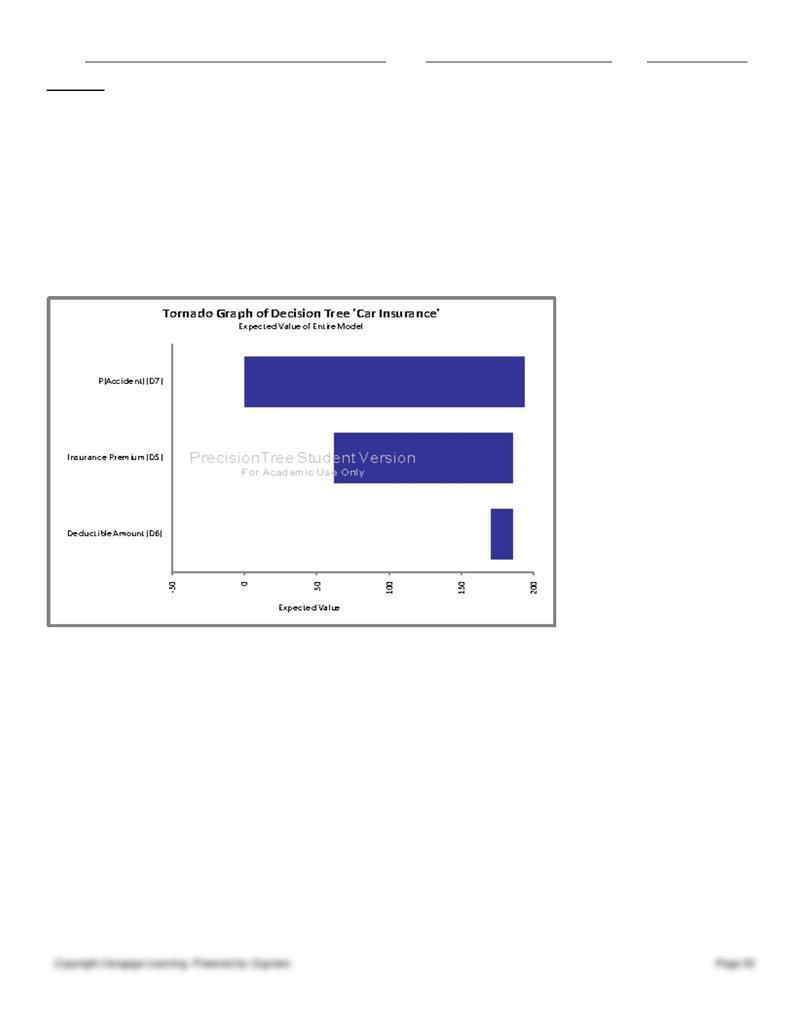
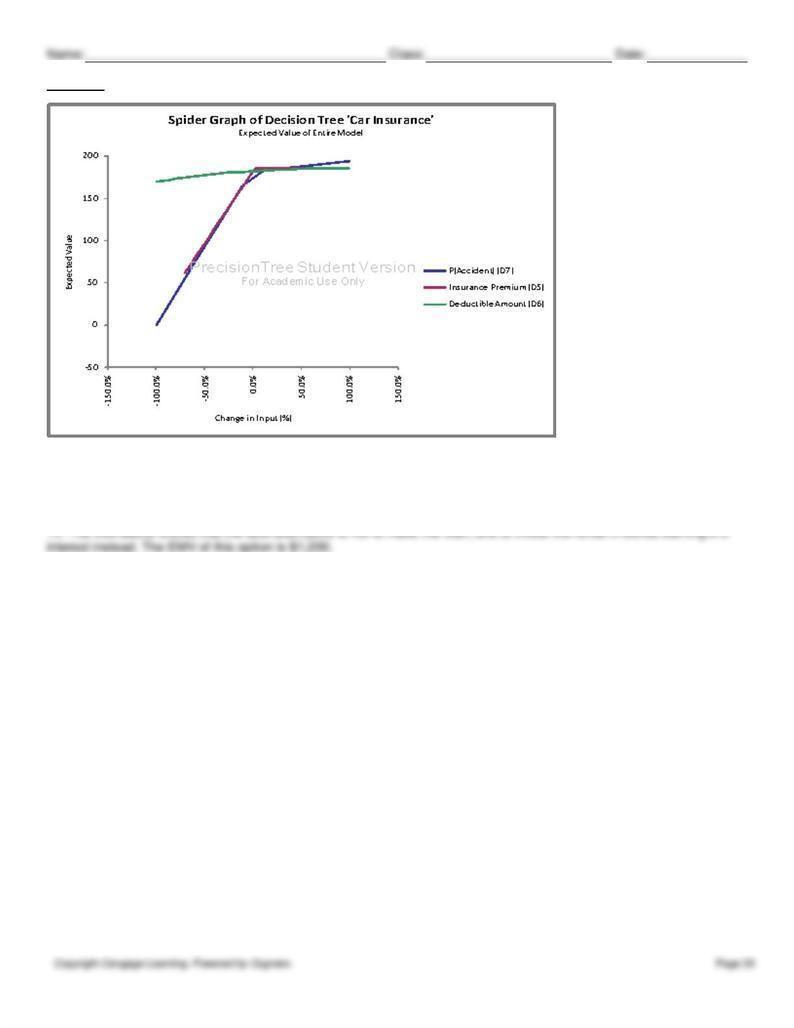
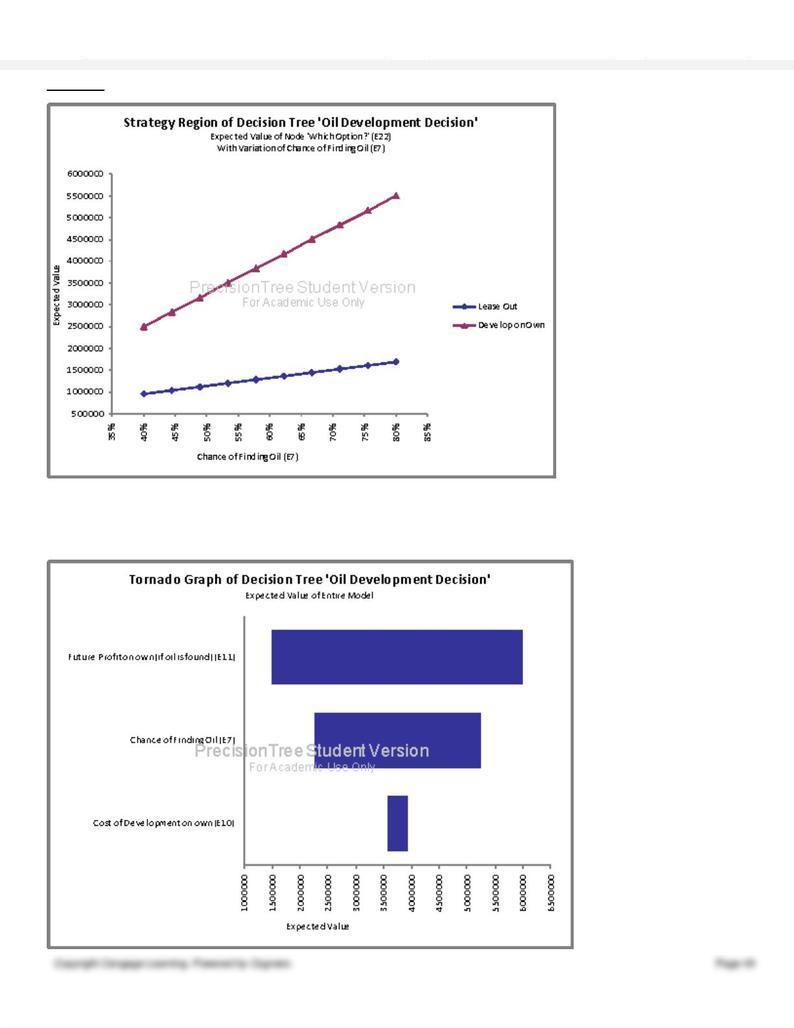
The tornado chart above shows that the probability of being in an accident is the input variable to which the expected
value is most sensitive, followed by the insurance premium. This is because this variable has the widest band and is
positioned at the top of the chart. The spider chart supports this finding, since the P(accident) line has the steepest slope.
75.

Name:
Class:
Date:
Name:
Class:
Date:
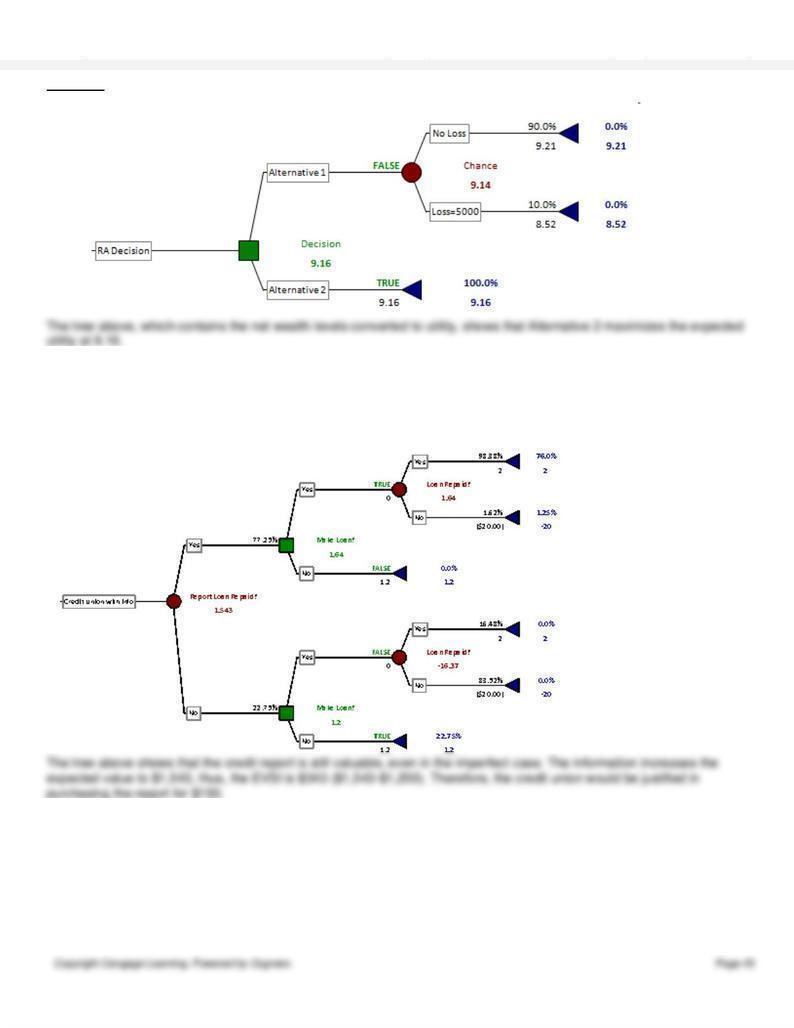
77.
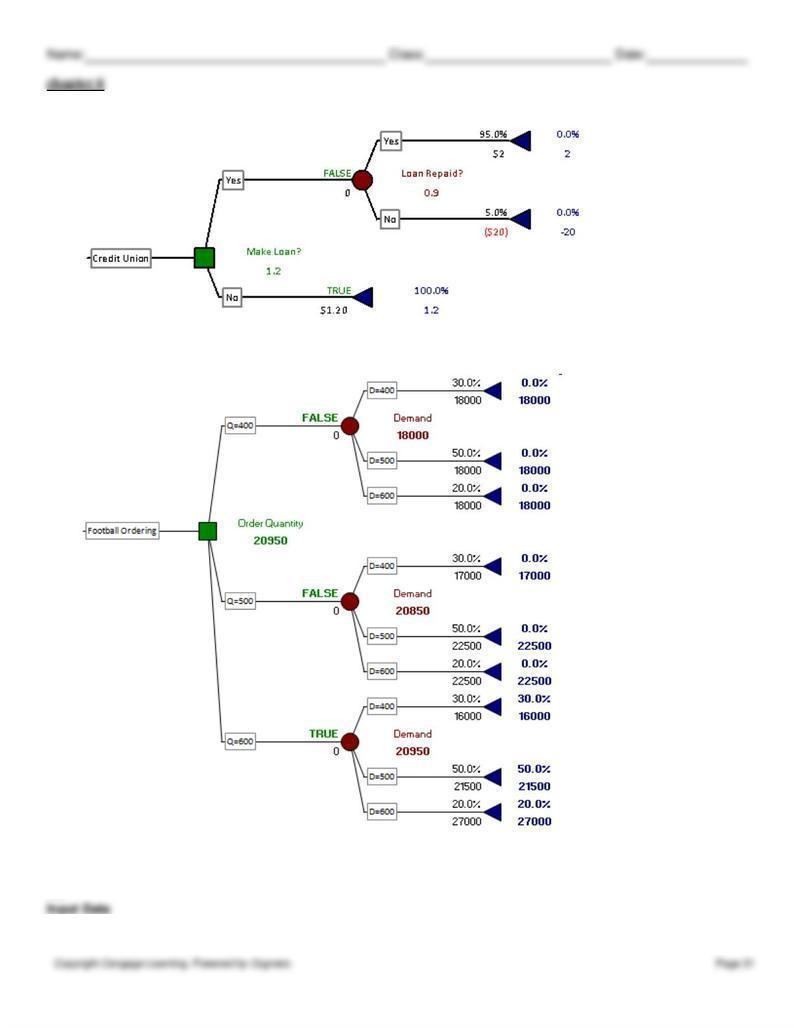
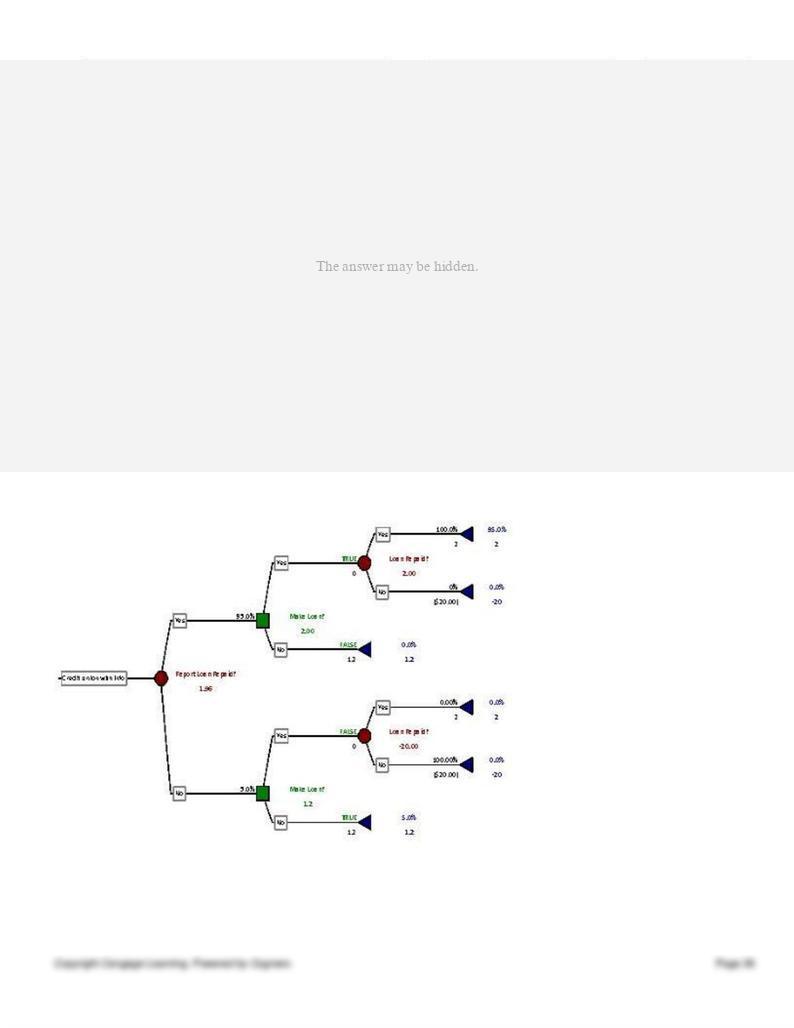
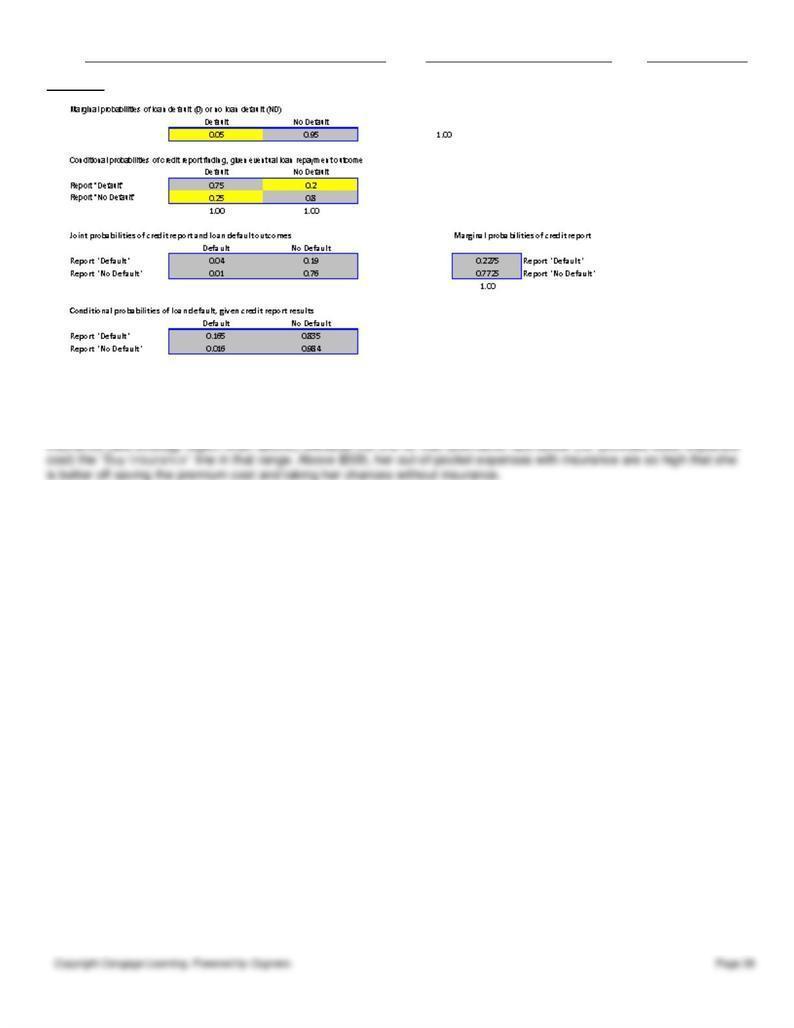
The tree above shows that if the credit report is favorable, the credit union should make the loan, and if the report is
unfavorable, it should not make the loan. This increases the expected value to $1,960 with the credit information. Thus,
the EVPI is $760, which is the most the credit union should be willing to pay.
chapter 6
78.
79.
80. If the probability of being in an accident were to fall much below 5%, Mrs. Rich would prefer not to purchase the
Name:
Class:
Date:
chapter 6
81.
82. If the insurance deductible were to increase to about $500, Mrs. Rich would be better off not purchasing the collision
83.
chapter 6
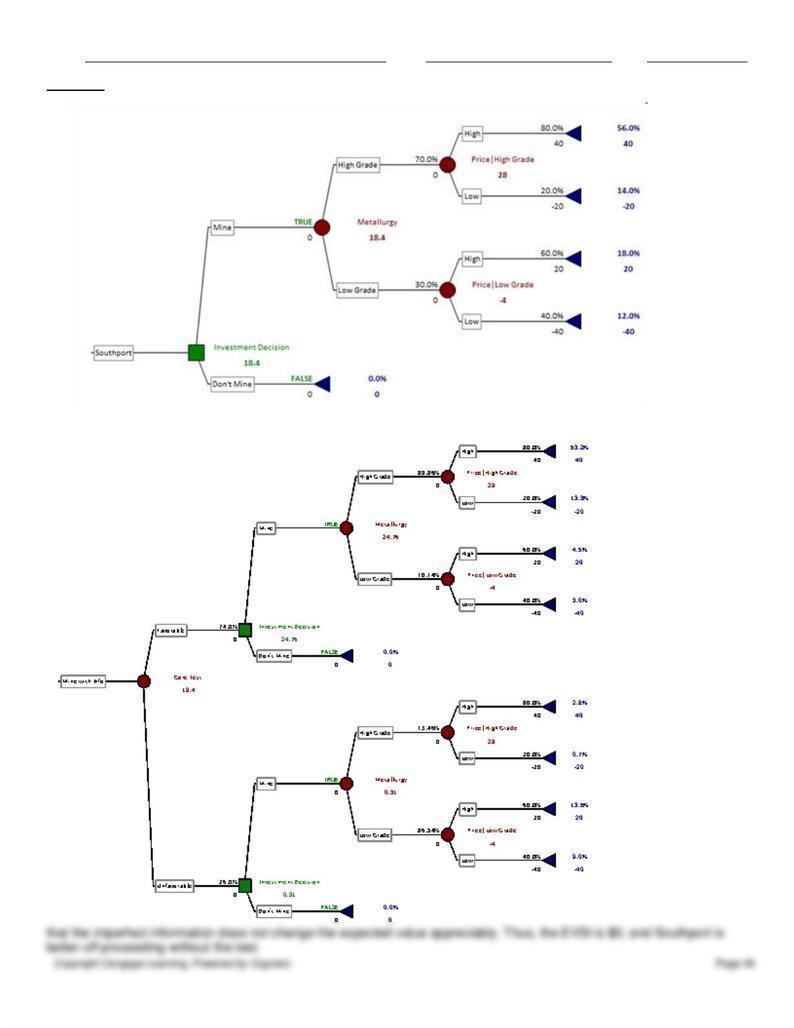
The tree above shows that having
the core information increases the expected value to $19.6m. Thus, the EVPI is $1.2m, which is the most Southport
should be willing to pay.
84. 0.5556
85.
chapter 6
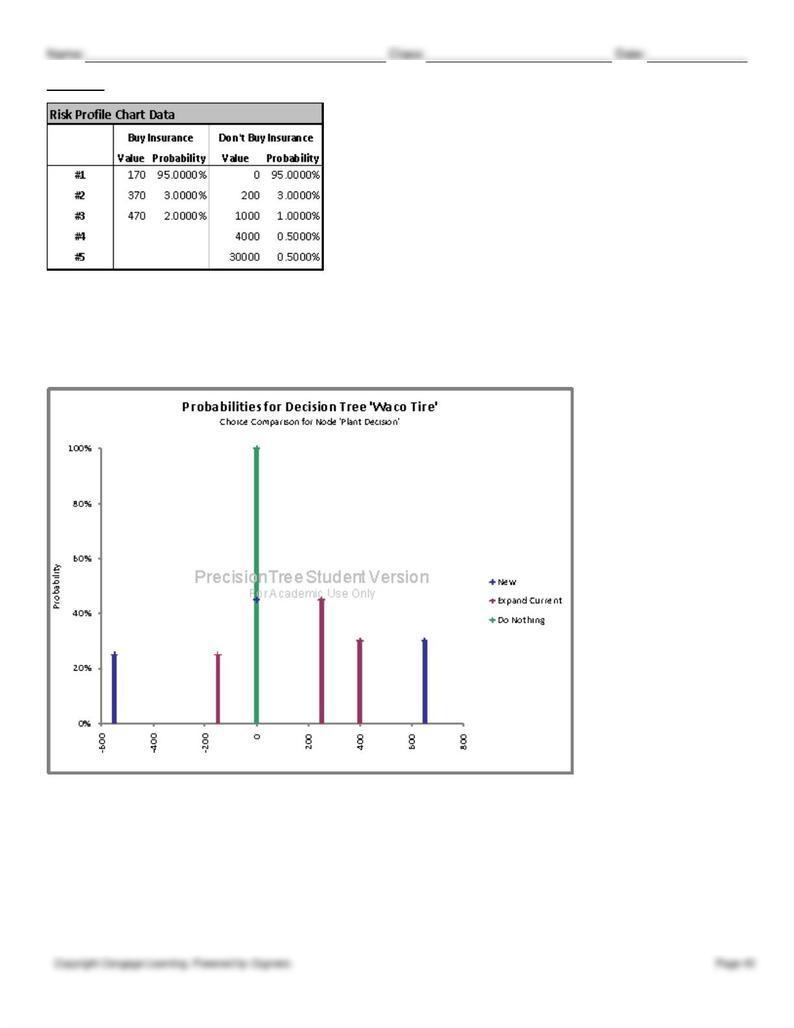
The statistical summary above shows much more risk with the “Don’t Buy Insurance” alternative, due to the much higher
standard deviation (2134.6 vs. 53.44). The risk profile also shows increased risk if she decides not to purchase insurance,
as indicated by greater dispersion of the outcomes. Since the “Buy Insurance” alternative already produces a lower
expected cost, this information on further supports that alternative as the optimal choice.
86.
There is obviously no risk from doing nothing. The risk profile above shows that the option of constructing a new plant is
much more risky, relative to the option of expanding the existing plant, as indicated by a large possible negative payoff
and the dispersion of the outcomes along the horizontal axis.
chapter 6
87.
88. (A)
Name:
Class:
Date:
chapter 6
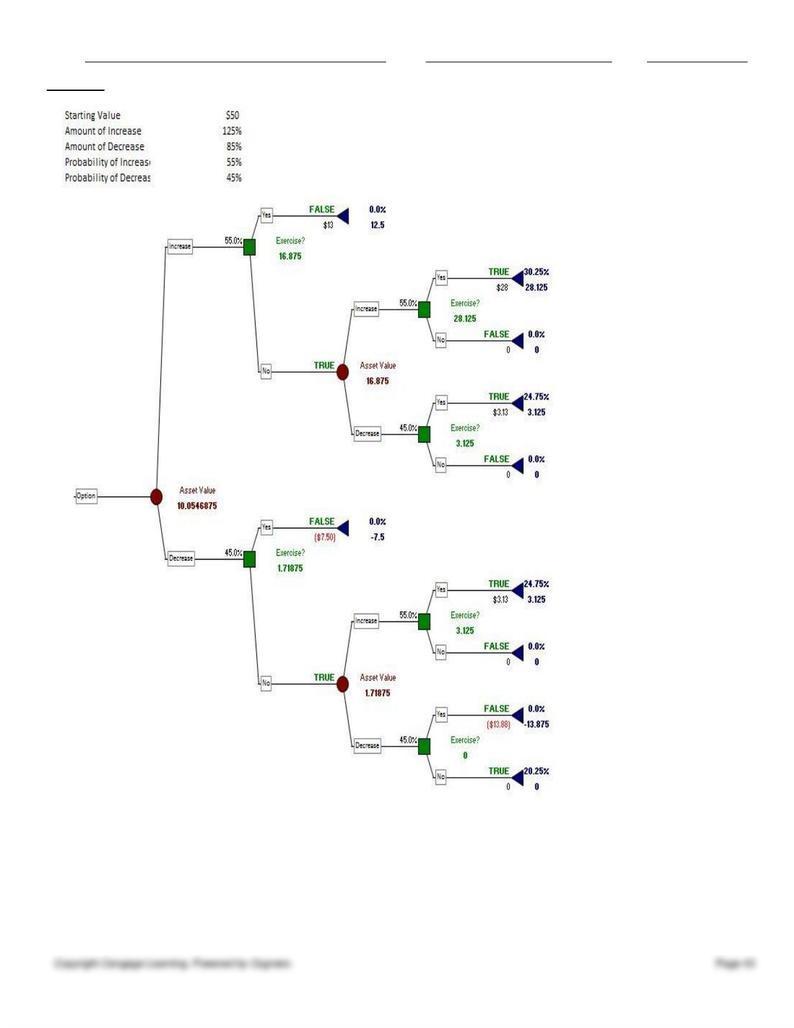
(B) The tree above shows that whether the price goes up or down in the first year, she should wait and not exercise the
options. If the stock price has gone up in the first year, then in the second year, she should exercise whether the price
goes up or down. However, if the price has gone down, she will only want to exercise the options if the price goes back up
during the second year. If the price goes down in both years, she will let the option expire.
(C) The expected value of the option on one share, as shown in the above decision tree, is $10.05. Therefore the option

Name:
Class:
Date:
chapter 6
on 2500 shares is worth $25,125 in additional compensation.
(D) No, the ability to make the decision not to exercise the option at every point in time protects the option-holder from
any possible loss. In the worst case, she will let the options expire and their value will be $0.
89. Recall that the minor accident damage amount is $200. Therefore, if she is in a minor accident and the deductible is
Name:
Class:
Date:
chapter 6
91.
92. The tree above shows that the best alternative is to invest in the mine. The EMV of this option is $18.4m.
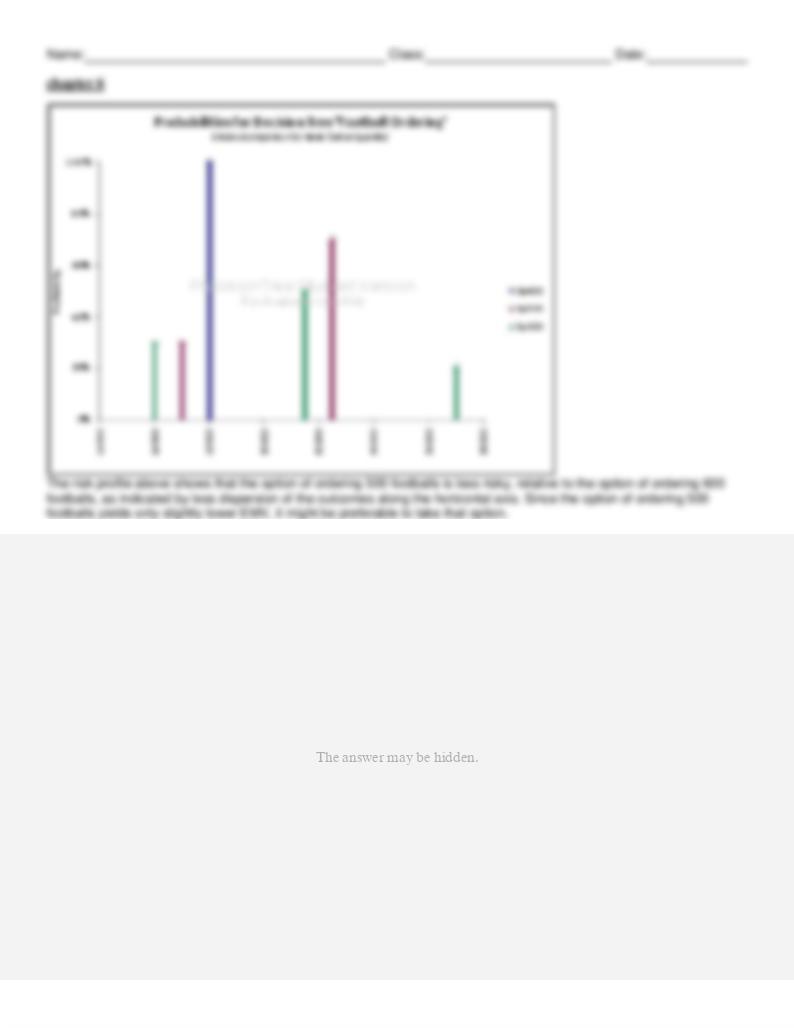
93. The best option in this case is to order 600 footballs. This option has an expected value of $20,950.
94.
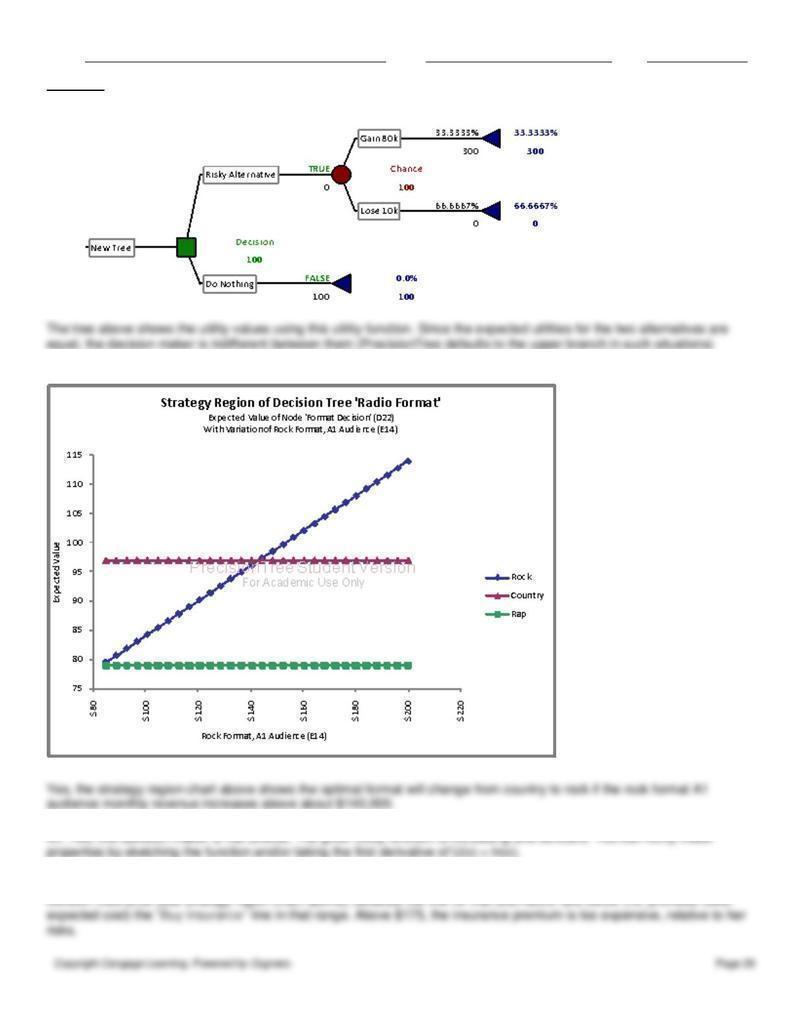
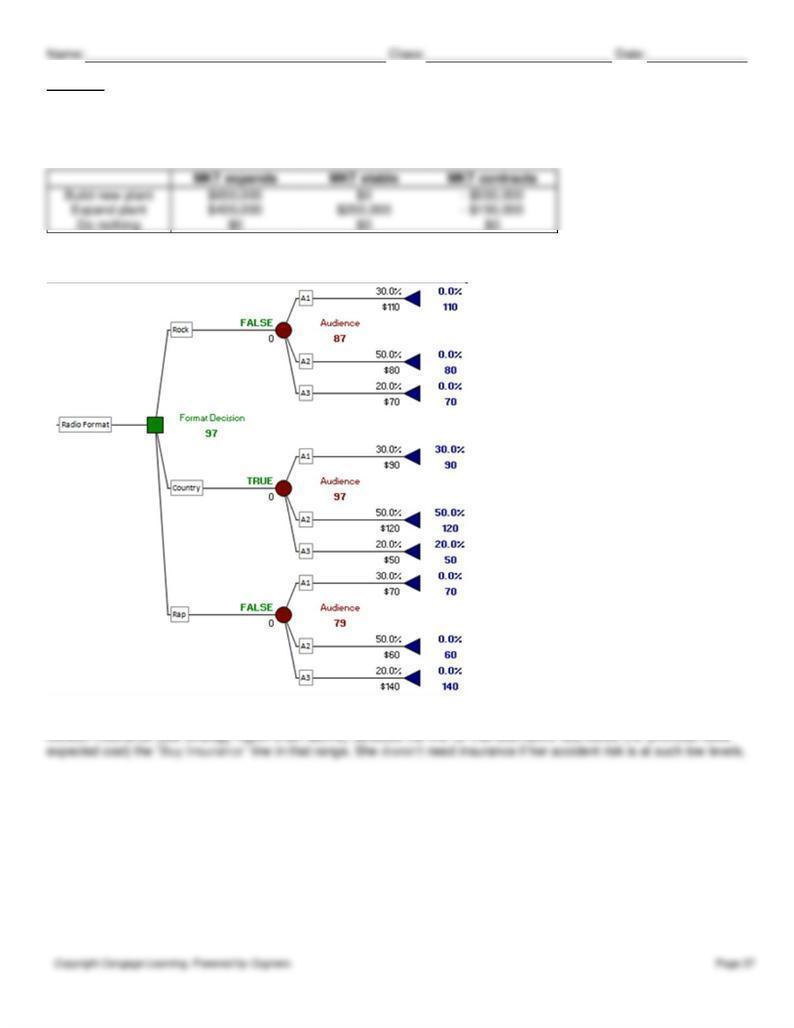
95. The tree above shows that the best course of action with the highest expected value is to select the country format.
The expected value of this option is $97,000.
Name:
Class:
Date:
chapter 6
96.
97.
The tree above shows
Name:
Class:
Date:
chapter 6
98. 0.64
99.
100. 0.4792
102.
Payoff table
104. The expected value is the same in either case:
Name:
Class:
Date:
105.
Name:
Class:
Date:
chapter 6
No, the strategy region chart above shows the best option is to conduct the exploration on her own over this
entire range of probability.
(D)
Name:
Class:
Date:
chapter 6
Name:
Class:
Date:
chapter 6
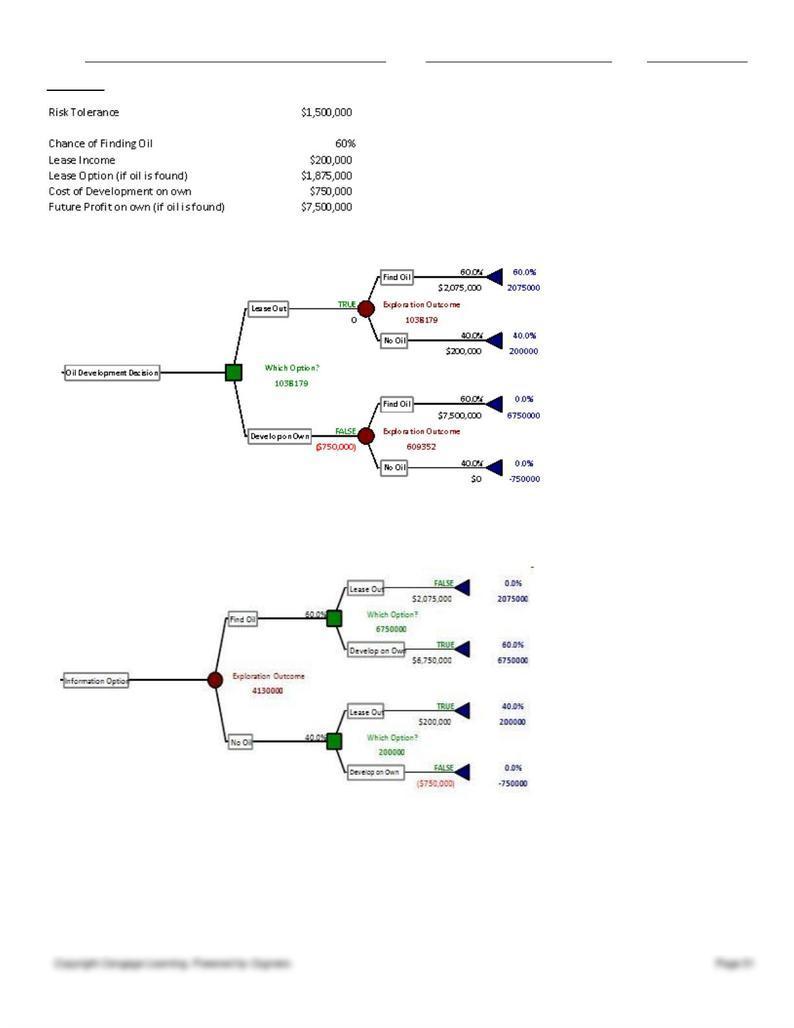
The decision tree shows the best option in this case is to lease out the prospect. This is option provides a
much higher certainty equivalent ($1.038m vs. $0.609M).
(H)
107.
chapter 6
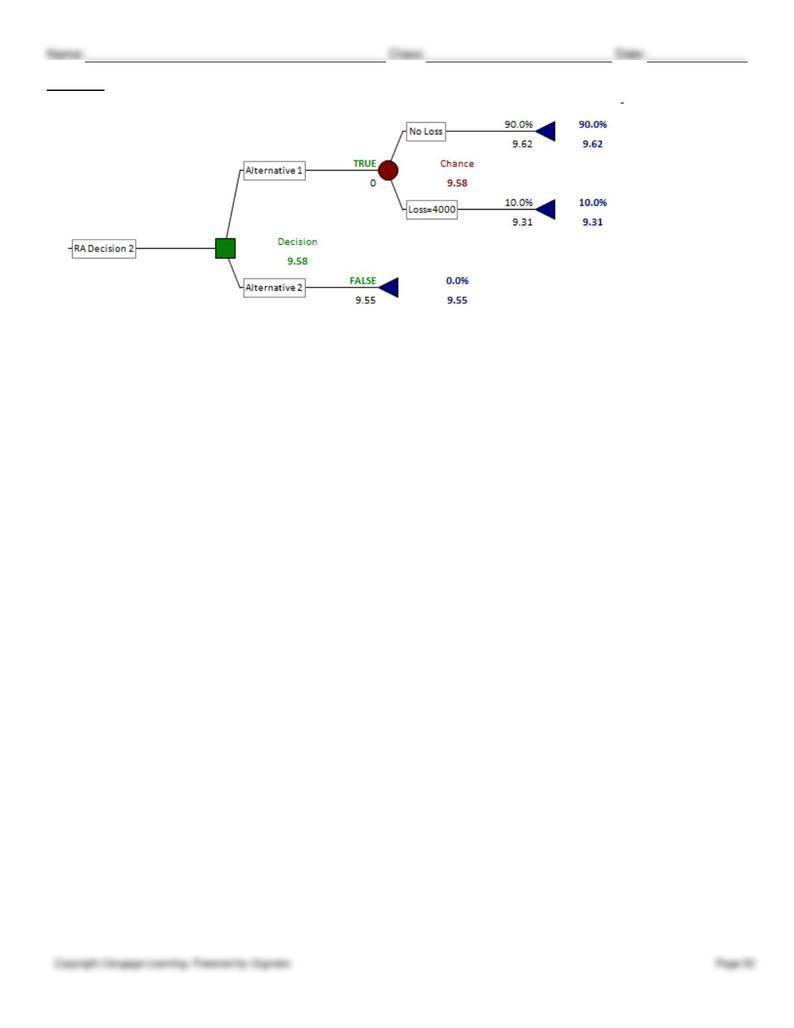
The tree above, which again contains the net wealth levels converted to utility, shows that Alternative 1 maximizes the
expected utility at 9.58.