Chapter 21
Income Inequality, Poverty, and Discrimination
Multiple Choice Questions
1.
In 2011, the average income for households in the United States was about:
2.
In the quintile distribution of income, the term "quintile" represents:
3.
In 2011, a household with an annual income of $75,000 would find itself in the:
4.
In 2011, a household with an annual income of $23,000 would find itself in the:
5.
The lowest quintile of households in the income distribution receives about:
A.
2.4 percent of the total income.
B.
3.2 percent of the total income.
C.
8.4 percent of the total income.
6.
The highest quintile of households in the income distribution:
7.
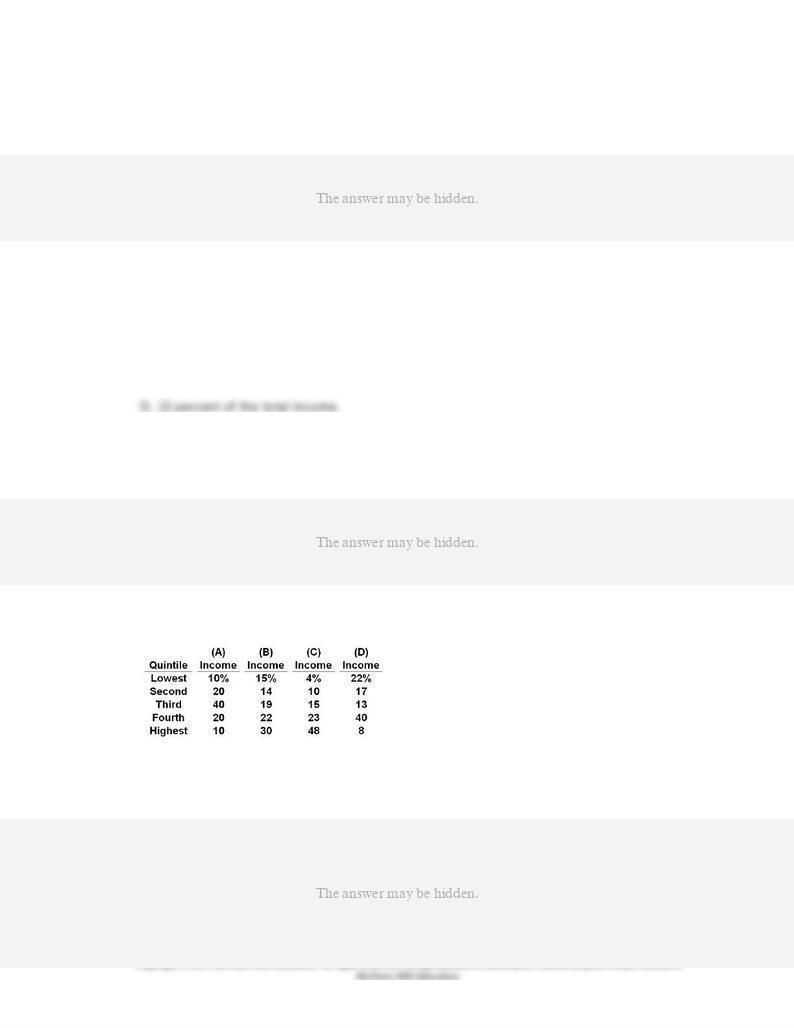
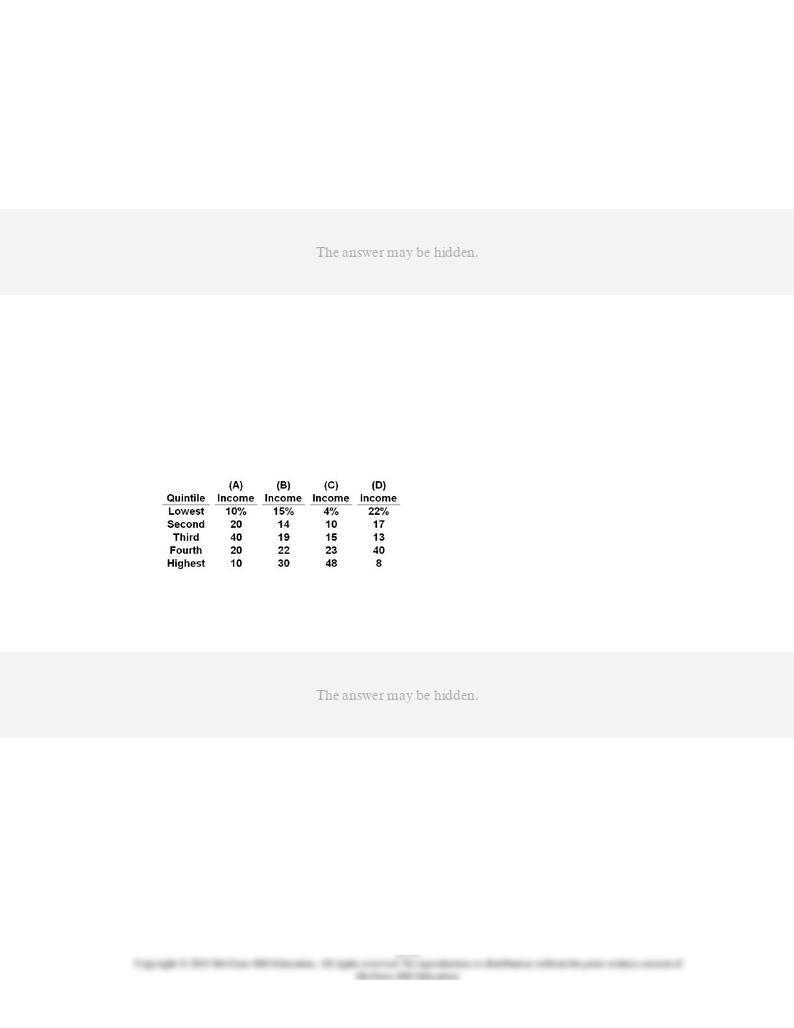
Answer the question on the basis of the following Census data.
Which of the given distributions is closest to describing the United States?
8.
In 2011, the highest quintile of households in the U.S. income distribution received about:
9.
Census data indicate that, as of 2011, the top fifth of all households receive about ________
times as much income as the bottom fifth.
10.
The Lorenz curve:
11.
The Lorenz curve portrays:
12.
The Gini ratio:
13.
The Gini ratio of income inequality ranges between:
14.
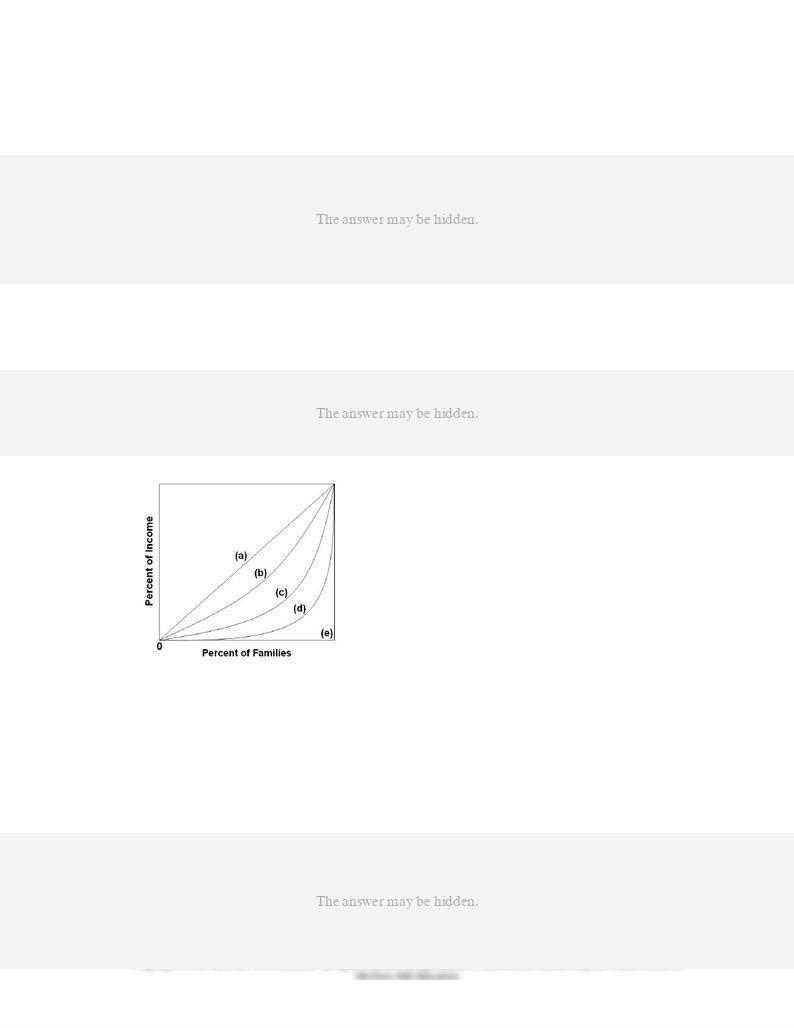
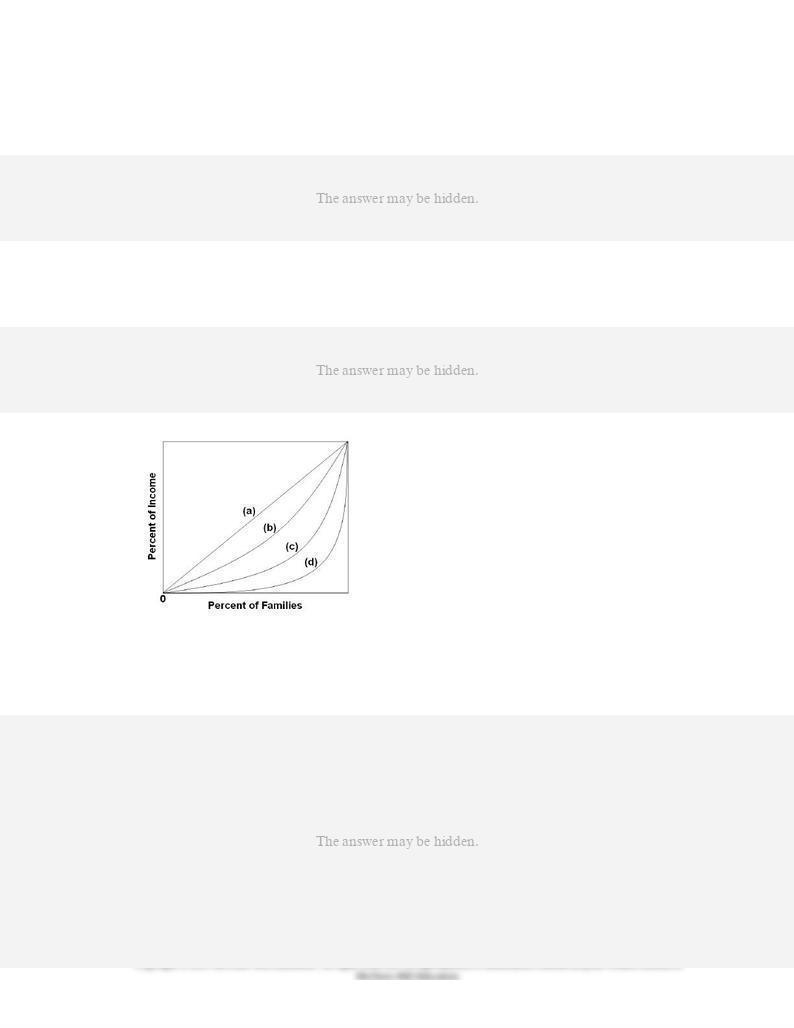
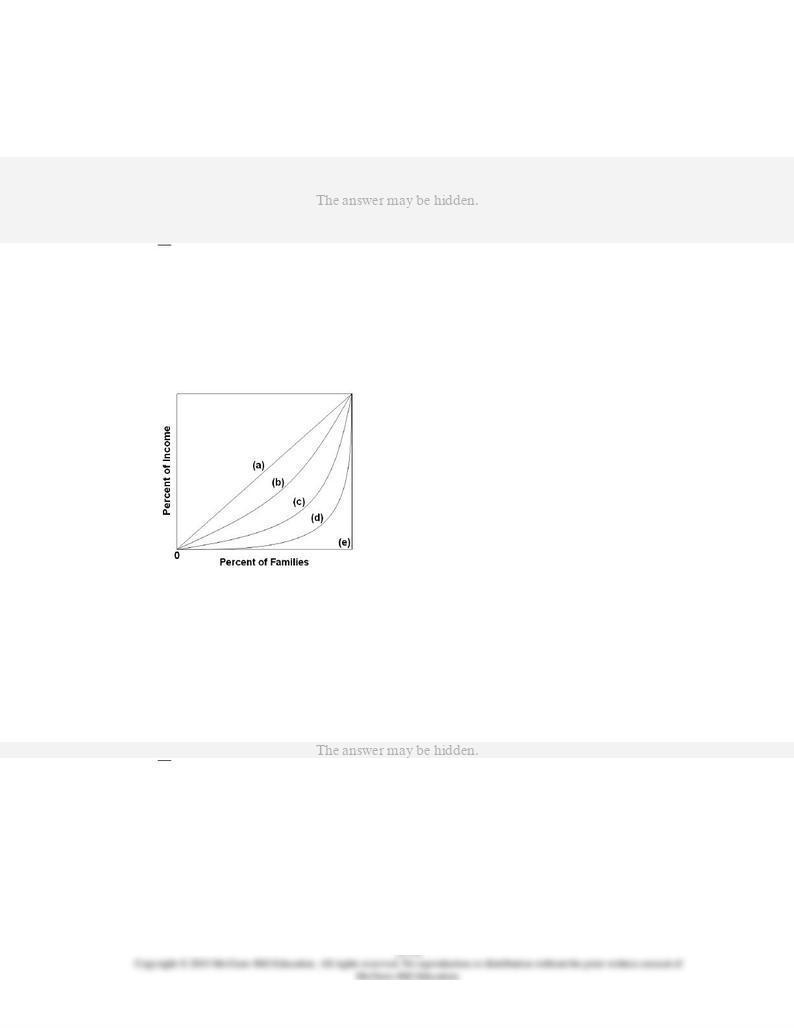
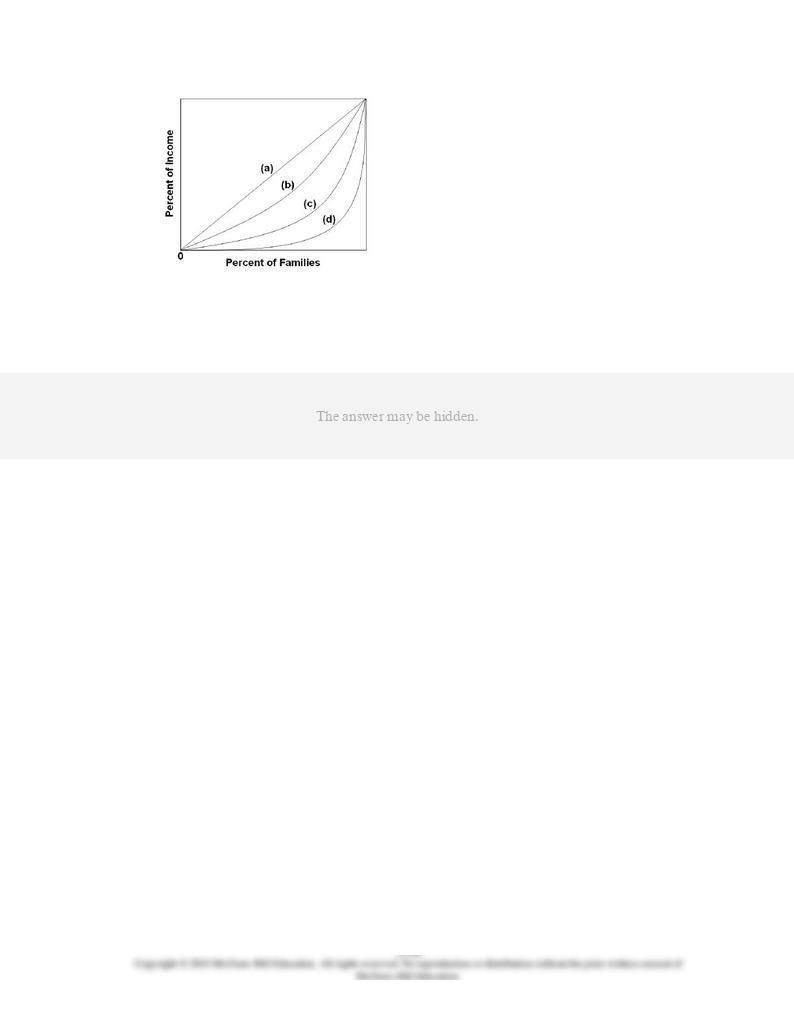
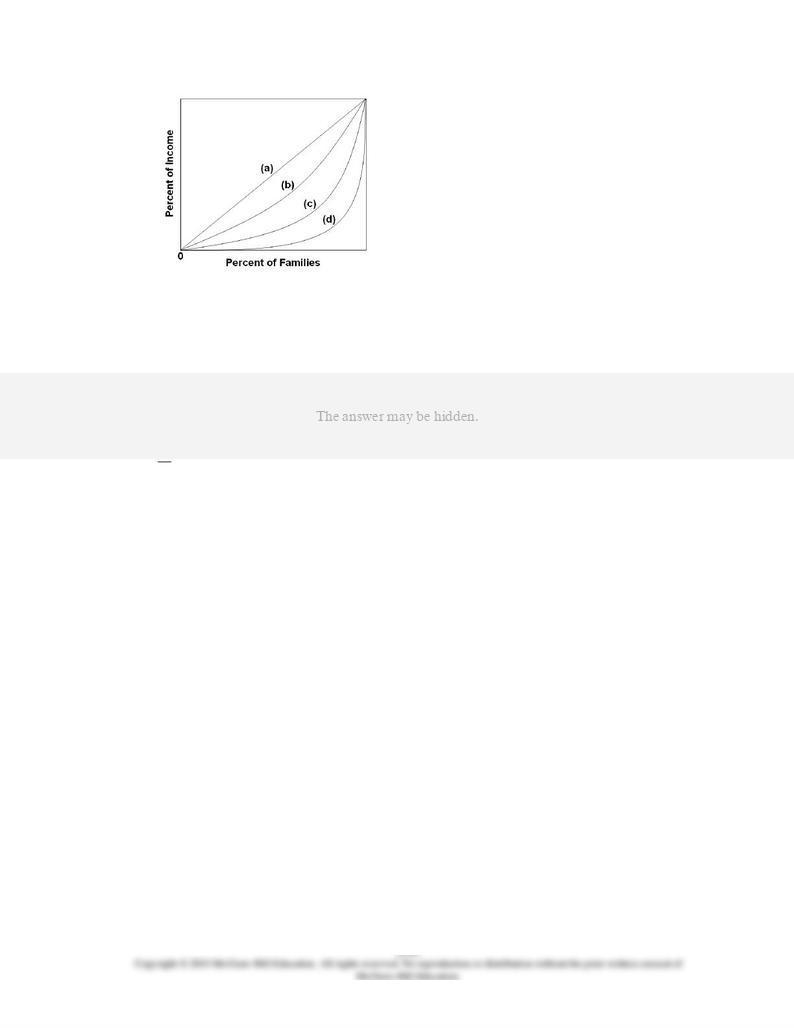
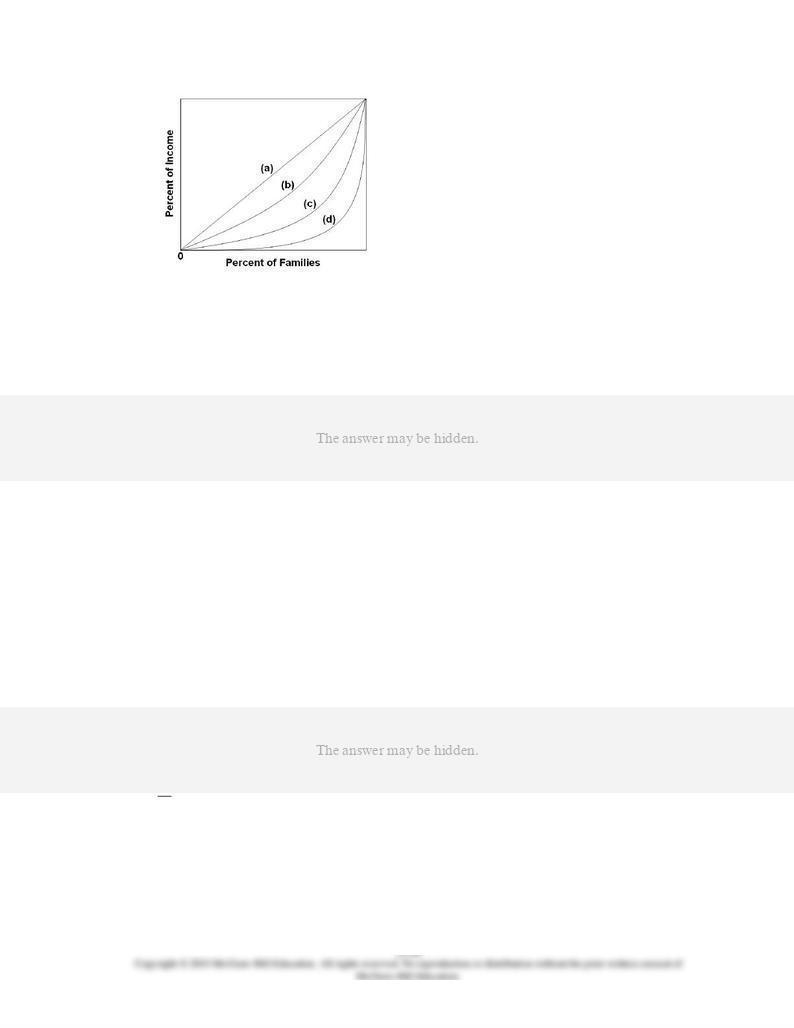
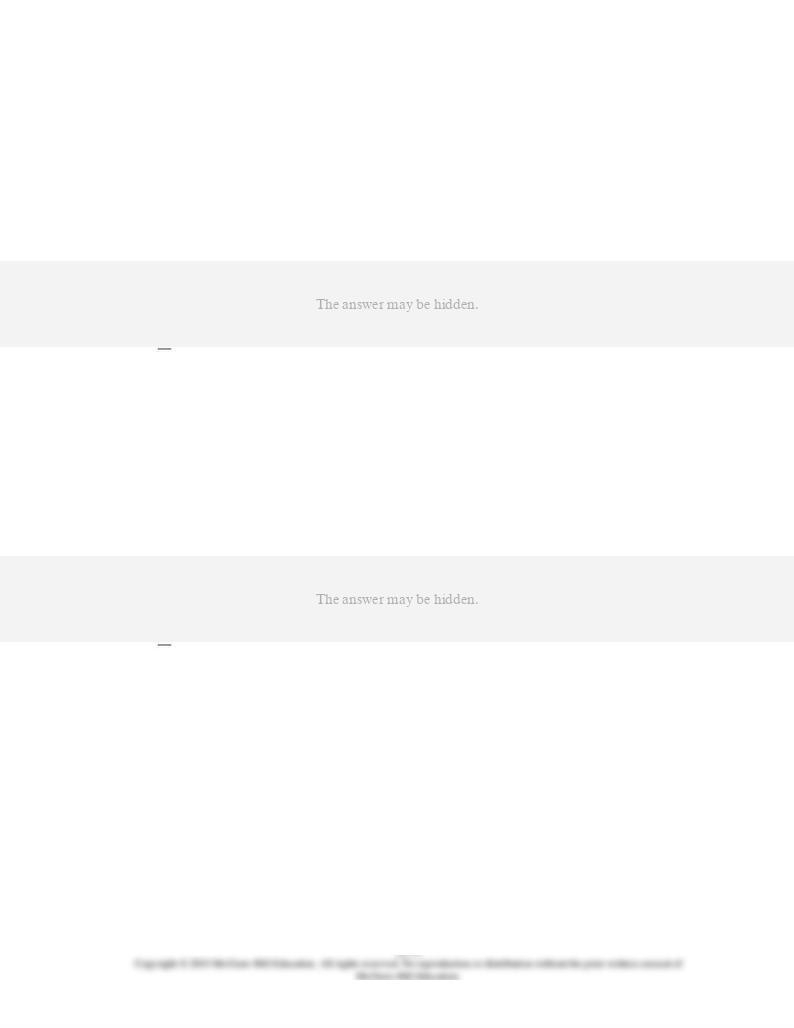
Refer to the diagram where curves (a) through (e) are Lorenz curves for five different
countries. Income is equally distributed in:
A.
none of the countries shown.
B.
country b.
C.
countries a and e.
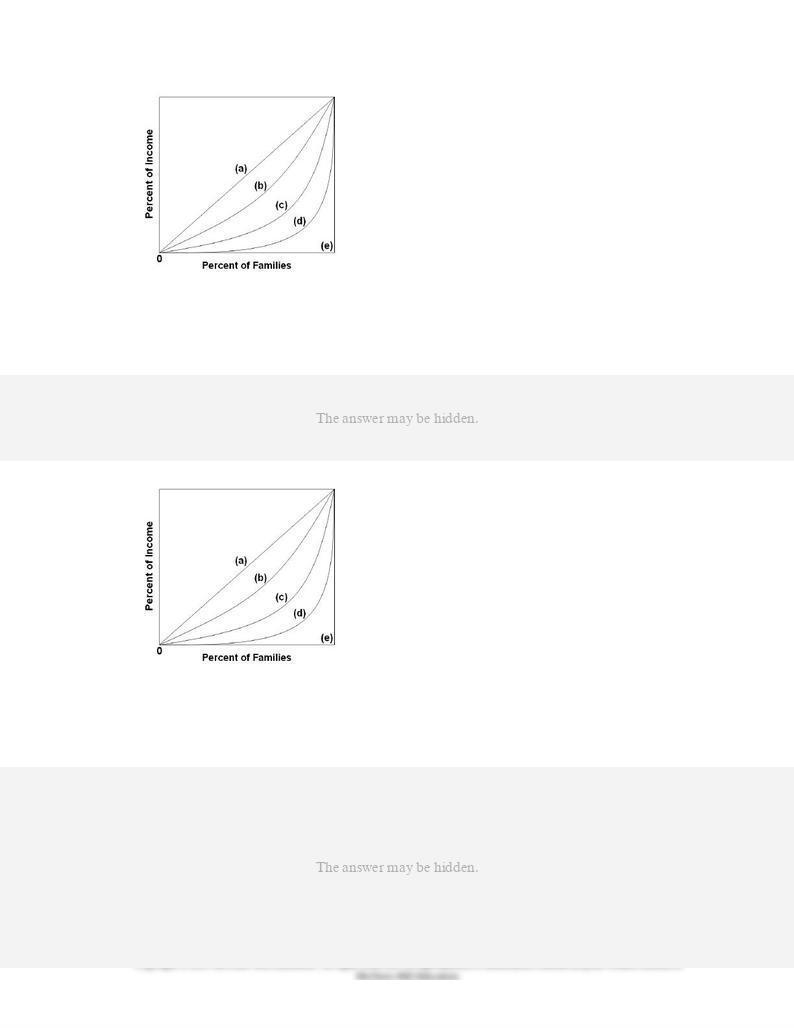
15.
Refer to the diagram where curves (a) through (e) are for five different countries. The Gini
ratio is lowest in country:
16.
Refer to the diagram where curves (a) through (e) are for five different countries. Of the
countries listed below, income is most unequally distributed in country:
17.
Refer to the diagram where curves (a) through (e) are for five different countries. The Gini
ratio is:
A.
zero in country (e) and 1 in country (a).
B.
greater in country (b) than in country (c).
18.
Answer the question on the basis of the following information. Suppose the members of
population A, consisting of Al, Bob, Curt, Doris, and Ellie, receive annual incomes of $5,000,
$2,500, $1,250, $750, and $500, respectively.
Refer to the given information. What percentage of total income is received by the richest
quintile?
A.
50.
B.
5.
C.
25.
D.
20.
19.
Answer the question on the basis of the following information. Suppose the members of
population A, consisting of Al, Bob, Curt, Doris, and Ellie, receive annual incomes of $5,000,
$2,500, $1,250, $750, and $500, respectively.
Refer to the given information. What percentage of total income is received by the lowest 60
percent of the income receivers in population A?
A.
60.
B.
50.
C.
25.
D.
20.
20.
Answer the question on the basis of the following information. Suppose the members of
population A, consisting of Al, Bob, Curt, Doris, and Ellie, receive annual incomes of $5,000,
$2,500, $1,250, $750, and $500, respectively.
Refer to the given information and this information as well. The members of population B,
consisting of Fred, George, Holly, Irma, and Joan, receive incomes of $4,000, $3,000, $1,250,
$950, and $800, respectively. We:
A.
can say that the income of population B is less equally distributed than that of population
A.
B.
can say that the income of population B is more equally distributed than that of population
21.
The greater the area between the Lorenz curve and the diagonal in the Lorenz curve diagram,
the:

22.
Which of the following Gini ratios indicates the highest degree of income inequality?
A.
0.78.
B.
0.65.
C.
0.29.
D.
0.42.
23.
Which of the following Gini ratios indicates the lowest degree of income inequality?
A.
0.71.
B.
0.55.
C.
0.31.
D.
0.45.
24.
Which of the following countries has the highest Gini ratio, as of 2011?
A.
Italy.
B.
United States.
25.
The movement of individuals and households from one income quintile to another over time
is called:

26.
Income mobility:
27.
Income mobility:
28.
In the United States, the lifetime distribution of income is more equal than the annual
distribution. This statement is:
29.
People's incomes are relatively low when they are young, reach a peak in middle age, and
then decline. This fact helps explain:
30.
Some economists have criticized standard government figures on income inequality, arguing
that these data:
31.
In the United States:
32.
Housing subsidies for low-income households:
33.
Standard Census data on the distribution of income:
34.
Which of the following is a noncash transfer?
35.
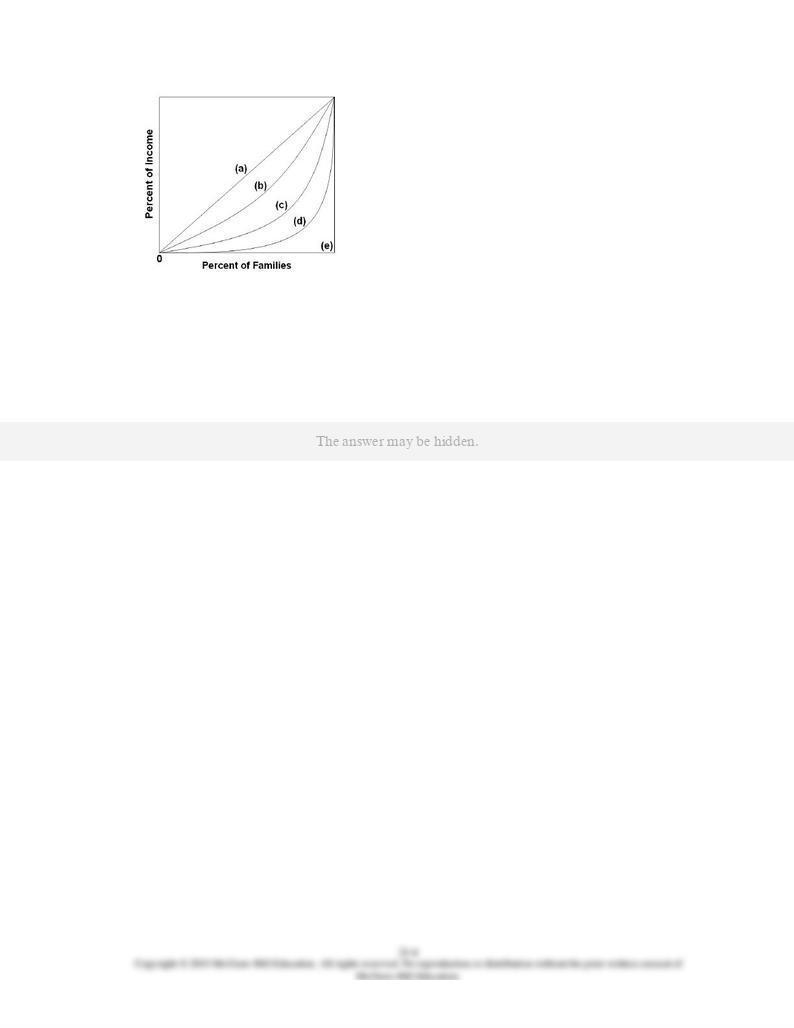
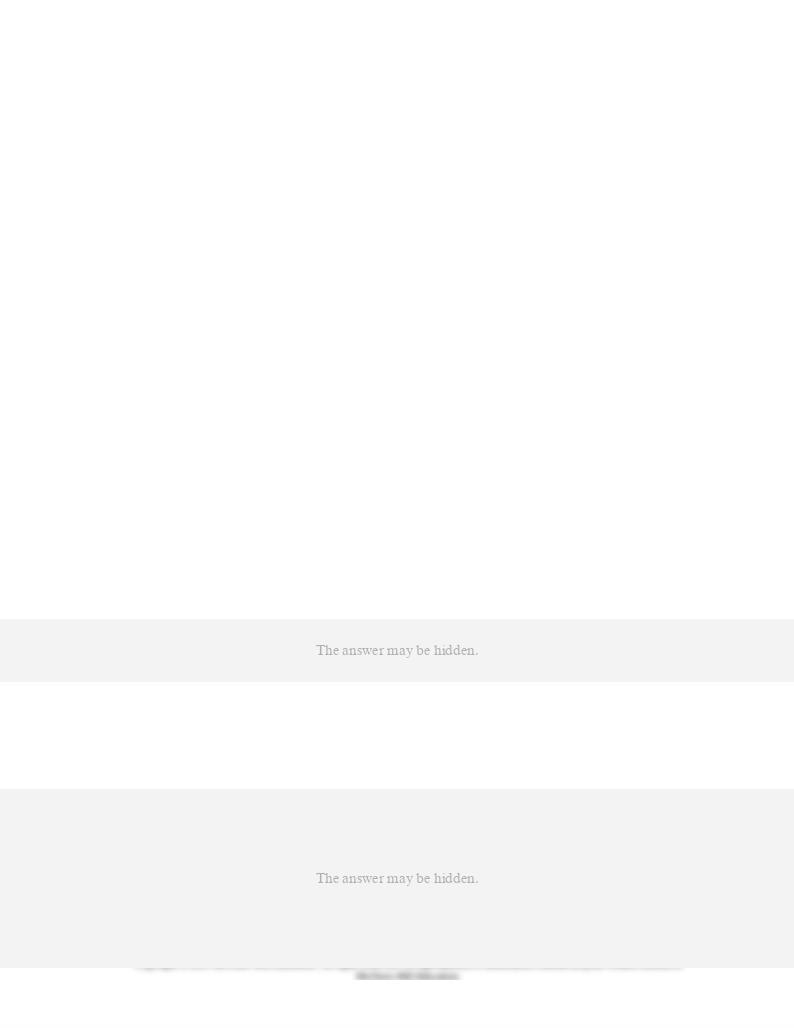
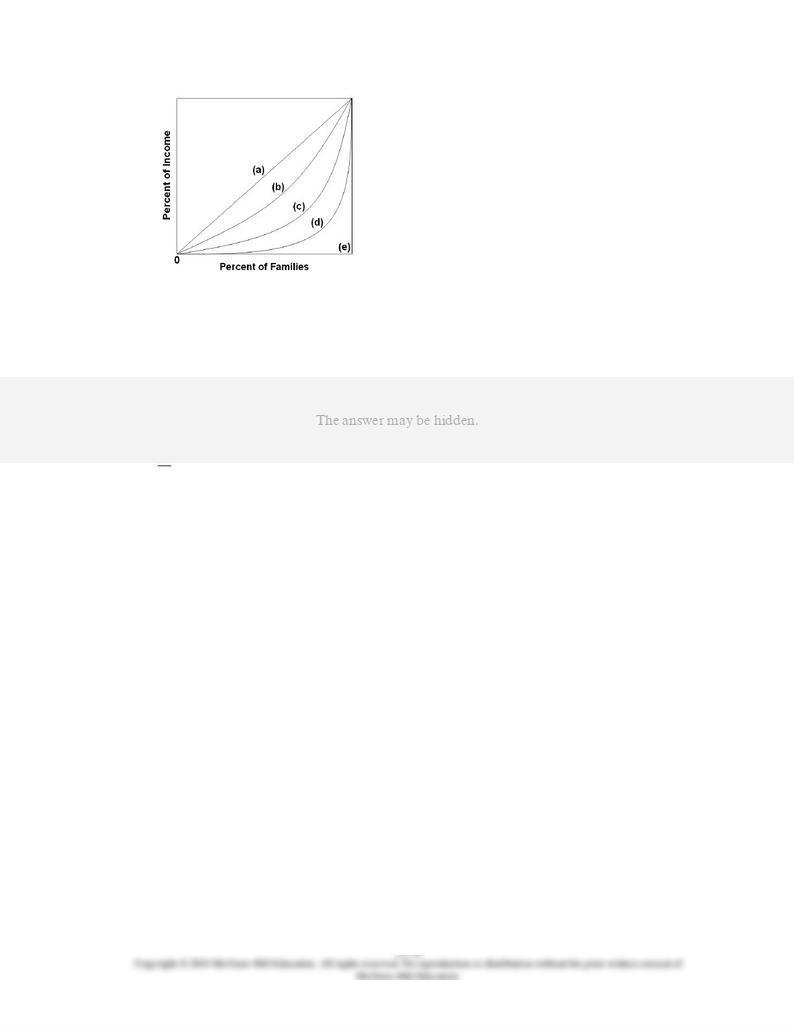
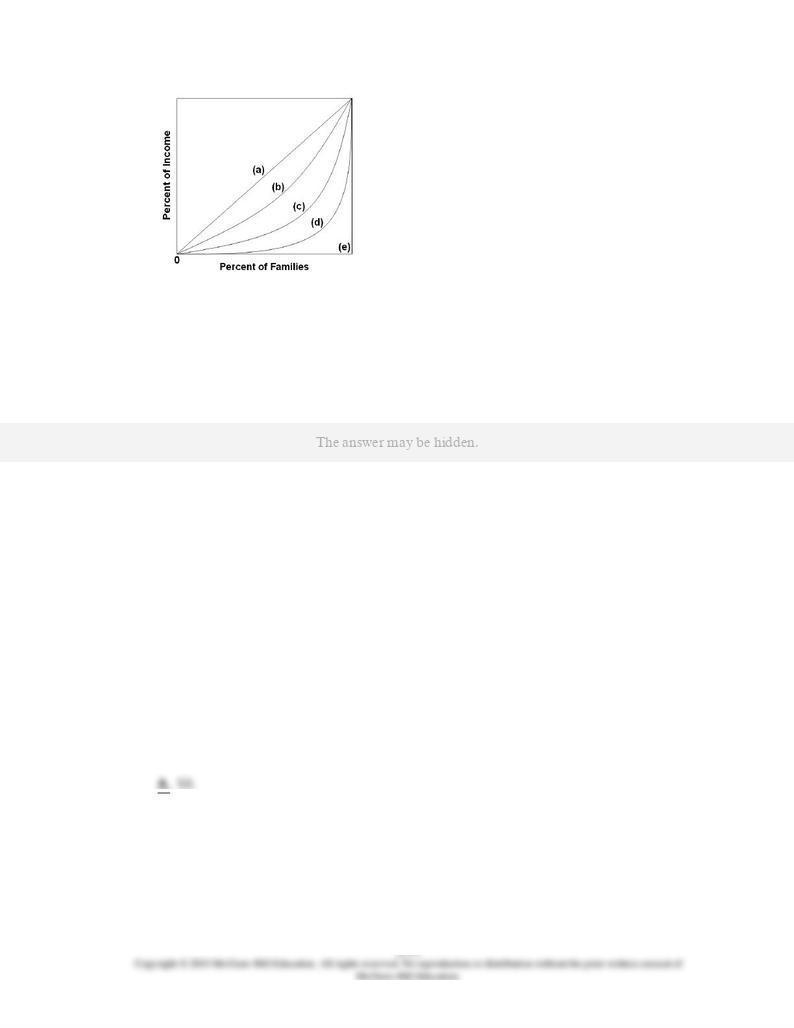
Refer to the diagram. If line (c) represents the pretax and transfer distribution of income in
the United States, we would expect the post-tax and transfer distribution to be:
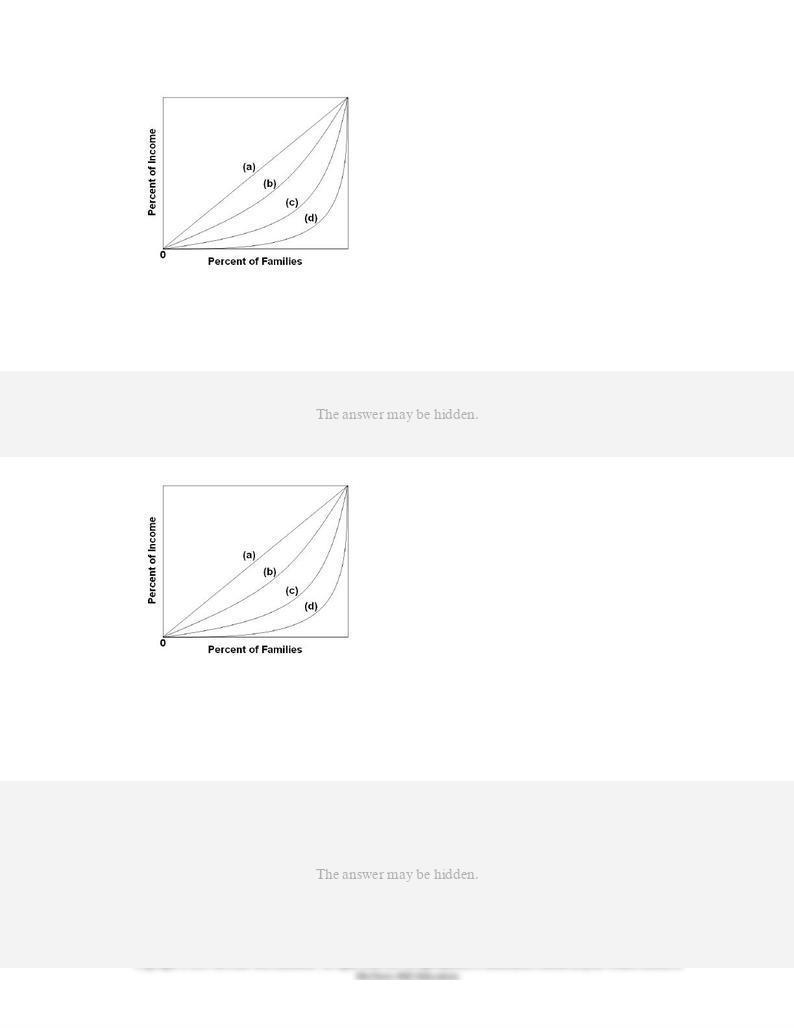
36.
Refer to the diagram. If line (c) represents the distribution of income in 1975 in the United
States, we would expect the distribution of income for 2011 to be more like:
37.
Refer to the diagram. If line (c) represents the distribution of income before taxes and
transfers and line (b) represents the distribution after taxes and transfers, then taxes and
transfers have:

38.
Each of the following contributes to income inequality
except
:
39.
If discrimination based on gender and race was eliminated, we would expect the:
40.
Differences in the amounts and quality of education and training:
41.
One cause of income inequality in the United States is:
42.
Which of the following would likely reduce income inequality?
43.
Income:
44.
Wealth:
45.
Which of the following is
correct
?

46.
Wealth in the United States is:
47.
The distribution of wealth in the United States is such that it:
48.
Which is
correct
?
49.
The exercise of market power by suppliers in resource markets tends to:

50.
Each of the following has contributed to growing income inequality in the United States since
1975
except
:
51.
Which of the following would most likely increase income inequality?
52.
Since 1975 the distribution of income has:
53.
Which of the following helps explain growing income inequality in the United States in recent
years?

54.
The term "growing income inequality" implies that the:
55.
Since 1980 the difference between the earnings of college graduates and high school
graduates has:
56.
The entrance of large numbers of "baby boomers" into the labor force in the 1970s and
1980s:
57.
The basic argument for income inequality is that:
58.
The basic economic argument for greater income equality is that:
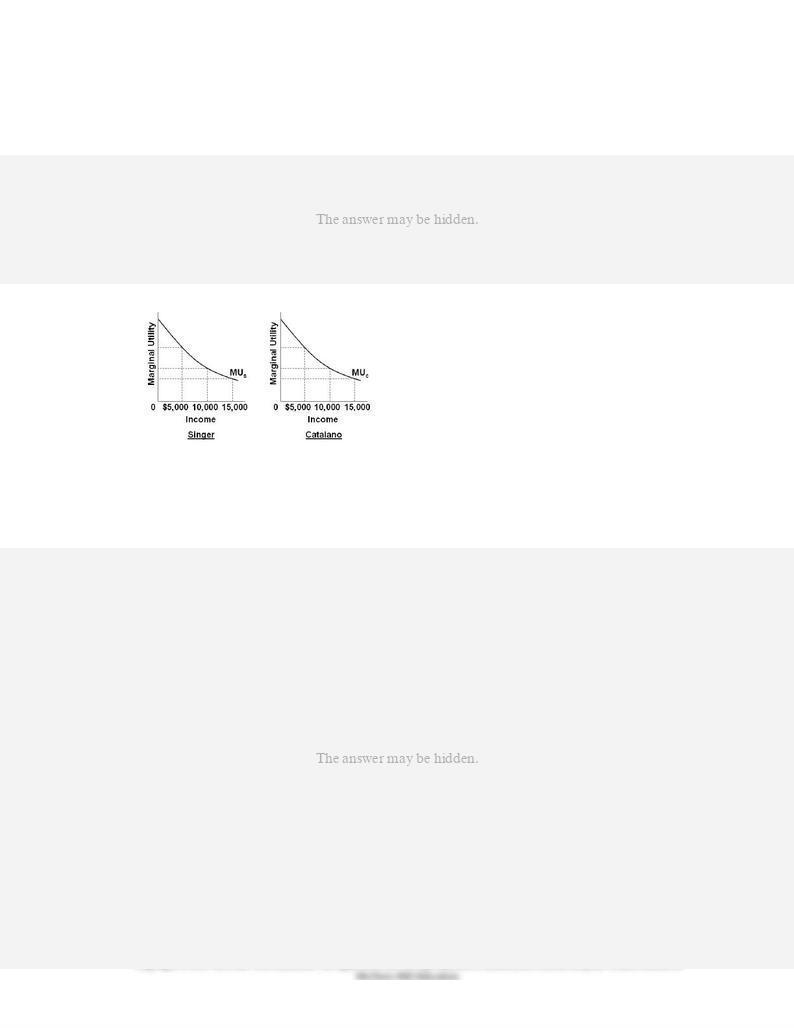
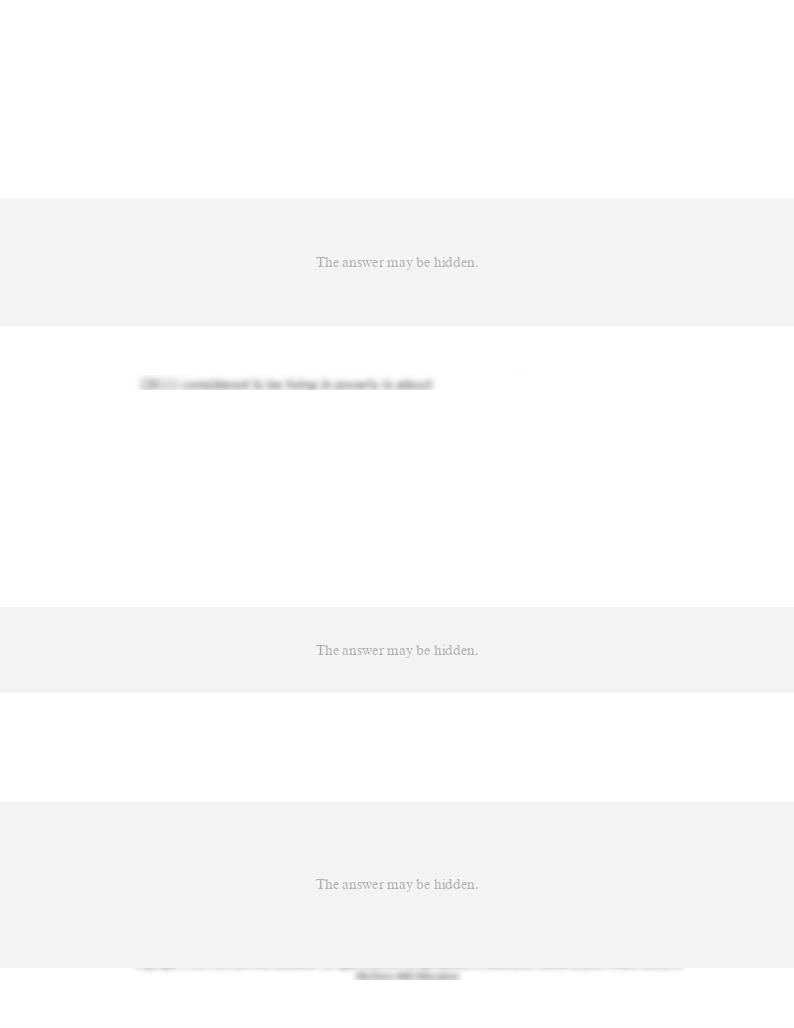
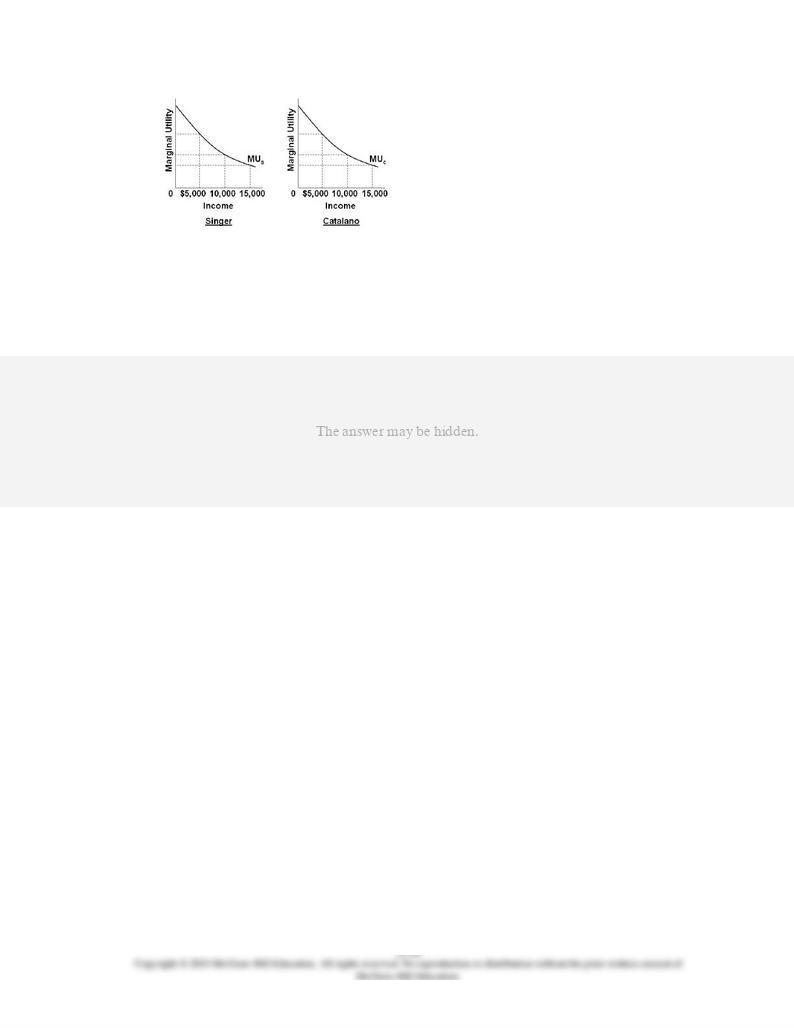
59.
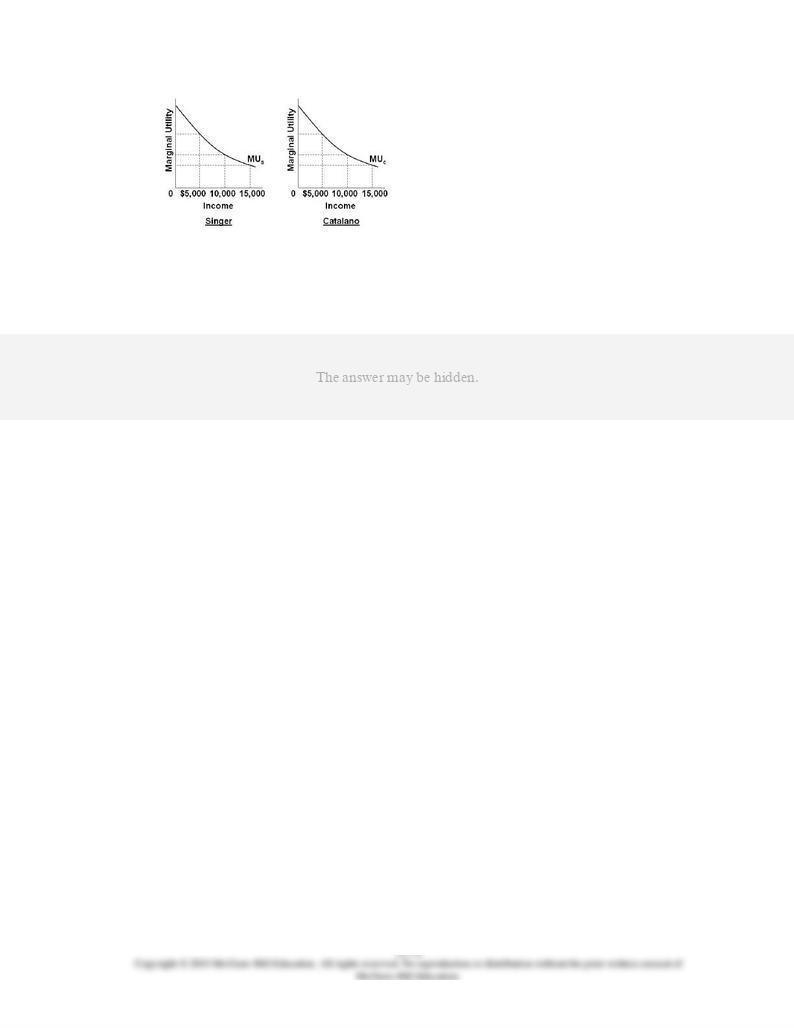
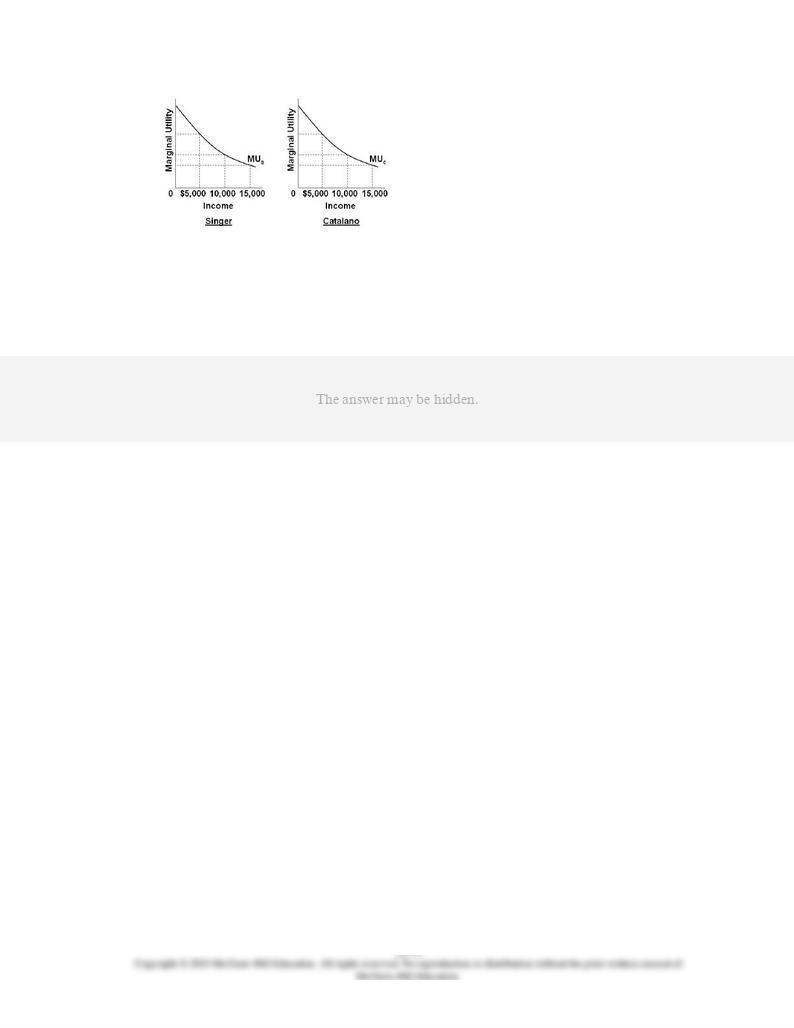
Refer to the diagrams that show identical marginal utility from income curves for Singer and
Catalano. The marginal utility from income curves are drawn on the assumption that:
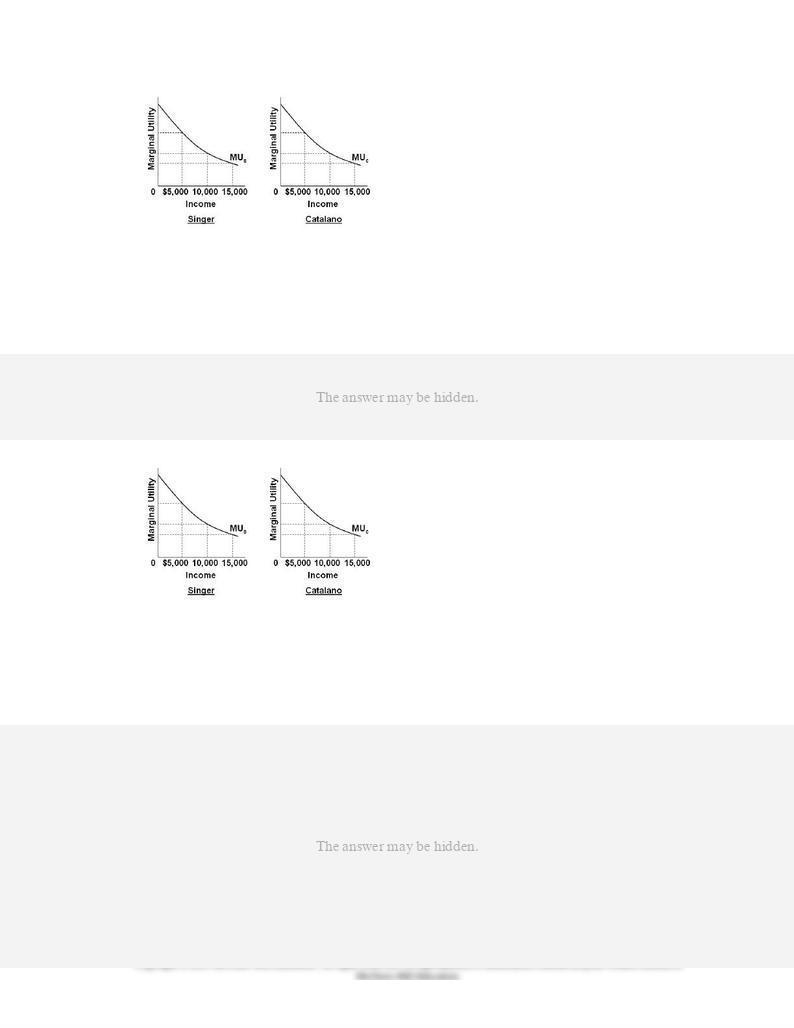
60.
Refer to the diagrams that show identical marginal utility from income curves for Singer and
Catalano. If a given income of $20,000 is initially distributed so that Singer receives $15,000
and Catalano $5,000, the marginal utility:
61.
Refer to the diagrams that show identical marginal utility from income curves for Singer and
Catalano. If a given income of $20,000 is initially distributed so that Singer receives $15,000
and Catalano $5,000:
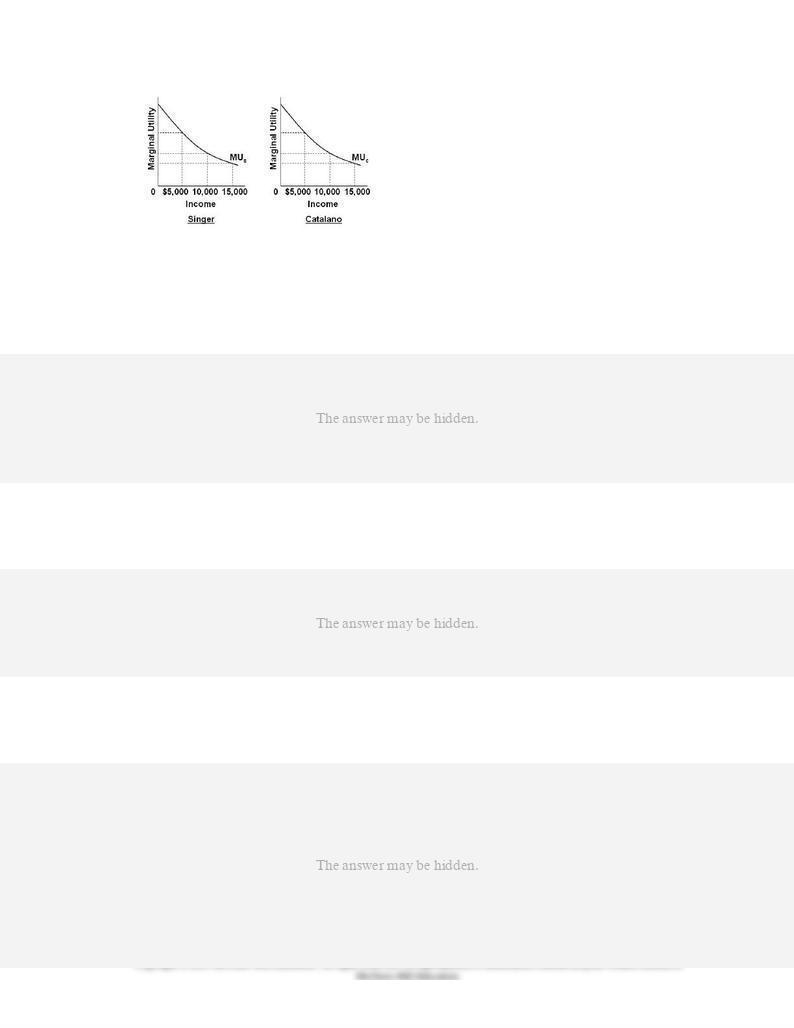
62.
Refer to the diagrams that show identical marginal utility from income curves for Singer and
Catalano. If an initial distribution of $15,000 to Singer and $5,000 to Catalano is altered in
favor of greater equality, it may be argued that:
63.
The equality-efficiency trade-off refers to:
64.
The equality-efficiency trade-off suggests that:
65.
Gomez argues that we need to increase the nation's output. Chang contends that our top
priority should be a more equal distribution of income and output. It can be correctly stated
that these two goals are:
66.
According to the standard government definitions, the percentage of the U.S. population now
A.
15.0 percent.
B.
20.5 percent.
C.
9.8 percent.
D.
13.2 percent.
67.
In 2011, the official poverty line for a household of four in the United States was:
68.
Which of the following demographic groups does
not
bear a disproportionate burden of
poverty?

69.
The poverty rate in the United States was:
70.
Which of the following groups has the
highest
poverty rate?
71.
Which of the following groups has the
lowest
poverty rate?
72.
The poverty rate for African Americans is:
73.
Which of the following would we expect to have the highest poverty rate?
74.
The U.S. poverty rate for:
75.
Which of the following measurement issues makes interpretation of U.S. poverty rates
difficult?
76.
Which of the following measurement issues makes interpretation of U.S. poverty rates
difficult?
77.
A major difference between social insurance and welfare is that social insurance:
78.
The U.S. income-maintenance program consists of two kinds of programs. They are:
79.
An example of a social insurance program is ____________, whereas an example of a public
assistance program is _______.
80.
Which of the following is
not
a social insurance program?
81.
Which of the following is a public assistance or welfare program as opposed to a social
insurance program?
82.
A major difference between social insurance and public assistance is that the:
83.
Social Security is financed:
84.
The primary purpose of Social Security is to:

85.
For which of the following income-maintenance programs is aggregate spending the
greatest?
86.
Medicaid:
87.
Which of the following terms describes a system of subsidized health insurance available to
the aged?
88.
Which of the following provides public assistance to those who are blind and otherwise
disabled?
89.
Which of the following helps finance the medical expenses of individuals receiving TANF or
SSI?
90.
The earned-income tax credit:
91.
All but which one of the following are cash transfer programs?
92.
Which one of the following would
increase
income inequality as measured by official Census
data and the quintile distribution?
93.
Which of the following would move the Lorenz curve closer to the diagonal?
94.
The TANF program:
95.
The TANF program is designed to:
96.
Since its inception in 1996, the Temporary Assistance for Needy Families (TANF) program
has:

97.
By December 2009, the recession that began in December 2007:
98.
The Supplemental Nutrition Assistance Program (SNAP):
99.
African-American worker Jackson earns $30,000 per year; white worker Johnson earns
$40,000 per year. On the basis of this information we can conclude that:
100.
For an employer biased against African Americans, the discrimination coefficient
d
:
101.
Which of the following employers is the most prejudiced? Employer:
102.
In the taste-for-discrimination model:
103.
Assume that all workers are equally productive, but the wage rate for men is $12 compared
to $9 for women. An employer who employs only male workers must have a discrimination
coefficient of:
D.
1.33 or less.
104.
An employer whose discrimination coefficient is $4 will:

105.
Suppose an employer is biased against African Americans. If his discrimination coefficient is
$2, the employer will:
106.
If there is a widespread bias against African-American workers, an increase in the collective
discrimination coefficients of employers will:
107.
In a labor market generally biased against Hispanics, a reduction in the collective
discrimination coefficients of employers will:

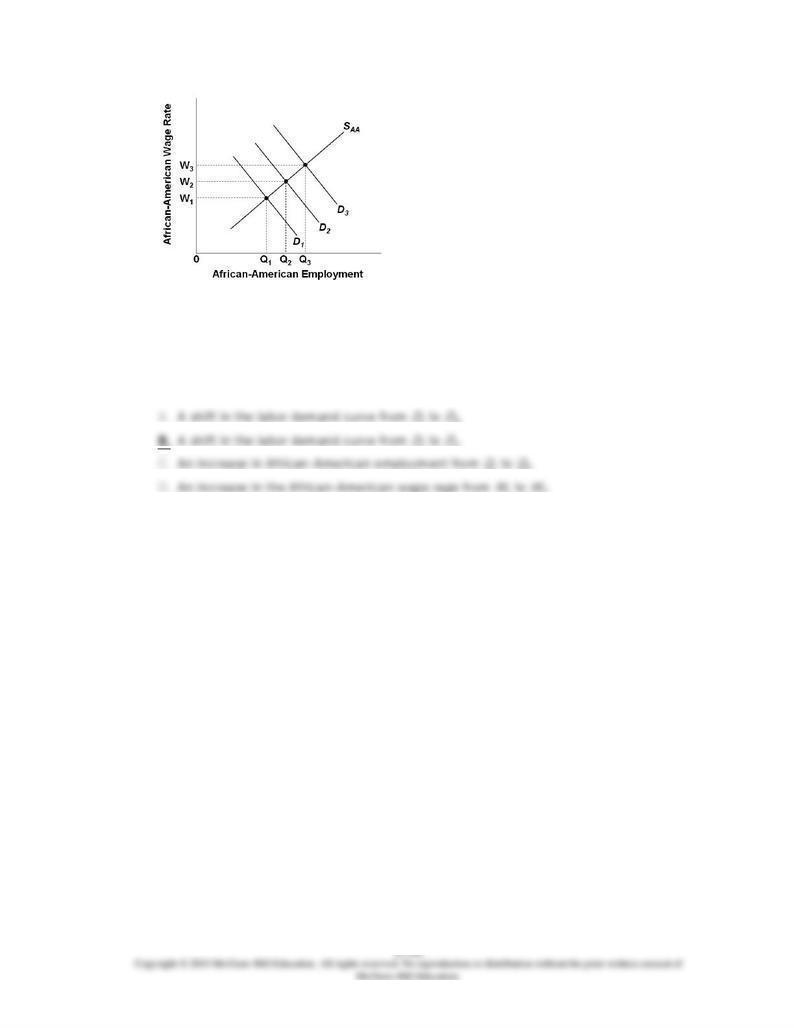
108.
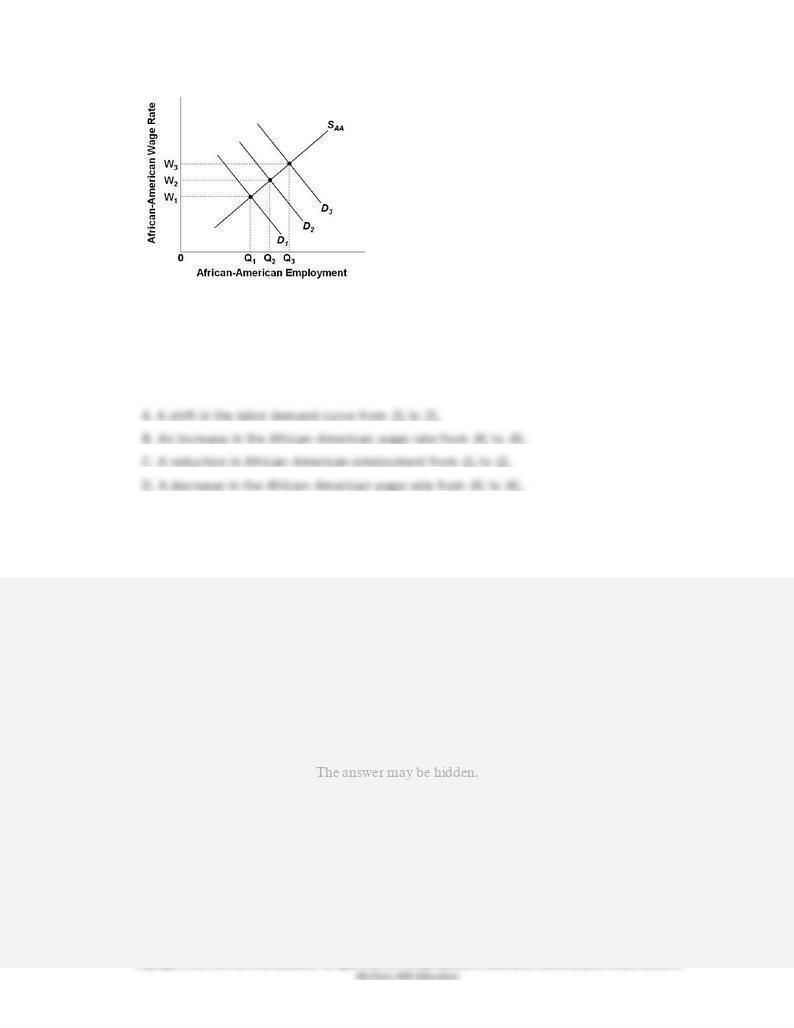
Refer to the diagram. Which of the following would be consistent with an
increase
in racial
prejudice against African Americans and thus an increase in the discrimination coefficients
of employers, taken as a group?
2 to
3.
2 to
1.
2 to
3.
1 to
2.
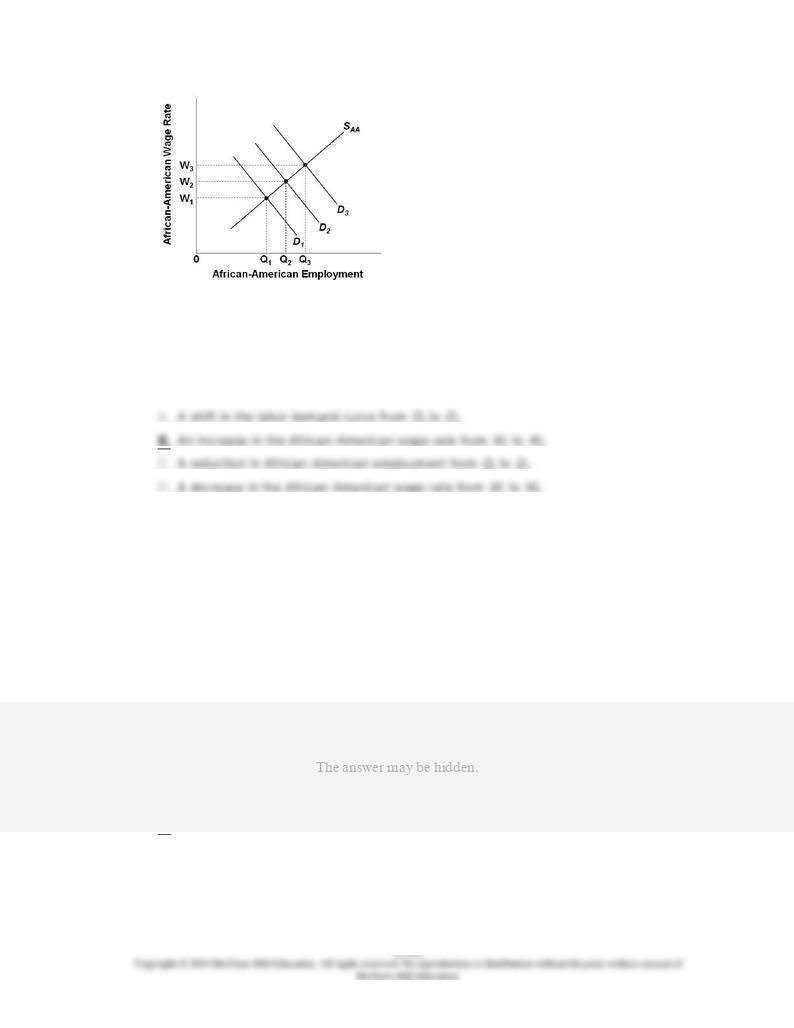
109.
Refer to the diagram. Which of the following would be consistent with a
decrease
in racial
prejudice against African Americans and thus a decrease in the discrimination coefficients of
employers, taken as a group?
3 to
2.
1 to
2.
3 to
2.
2 to
1.
110.
In the taste-for-discrimination model:

111.
An implication of the taste-for-discrimination model is that:
112.
An employer is prejudiced, prefers to hire white rather than Hispanic workers, and is willing
to pay higher wages to obtain white workers. This illustrates:
113.
Statistical discrimination refers to:
114.
Statistical discrimination:
115.
Insurance companies require male drivers under age 25 to pay higher insurance rates than
female drivers under age 25. Craig Raymond, however, is a safer driver than the average
female driver under age 25. Craig's higher insurance rate reflects:
116.
Statistical discrimination:
117.
Which of the following is an example of statistical discrimination?
118.
Suppose Gigantic Health Cooperative doesn't hire Mandy Morrison solely because she is a
graduate of a particular foreign medical school, which is not known for the high quality of its
graduates. Yet, Mandy is actually more qualified than the average graduate of American
medical schools. This is an example of:
119.
Suppose Copernicus Corporation hires Damon Danielson rather than Elmer Ellison, simply
because Damon is a graduate of an Ivy League school while Elmer is a graduate of a small
public university. Elmer is actually more qualified than Damon. This is an example of:
120.
A particular woman is denied on-the-job training because women on average are more likely
to drop out of the workforce than men. This illustrates:
121.
The crowding model of discrimination suggests that:
122.
The crowding of women and minorities into a restricted number of occupations:
123.
Minority workers are underrepresented and have less access to certain high-paying
occupations. This illustrates:
124.
The crowding model is primarily concerned with explaining:

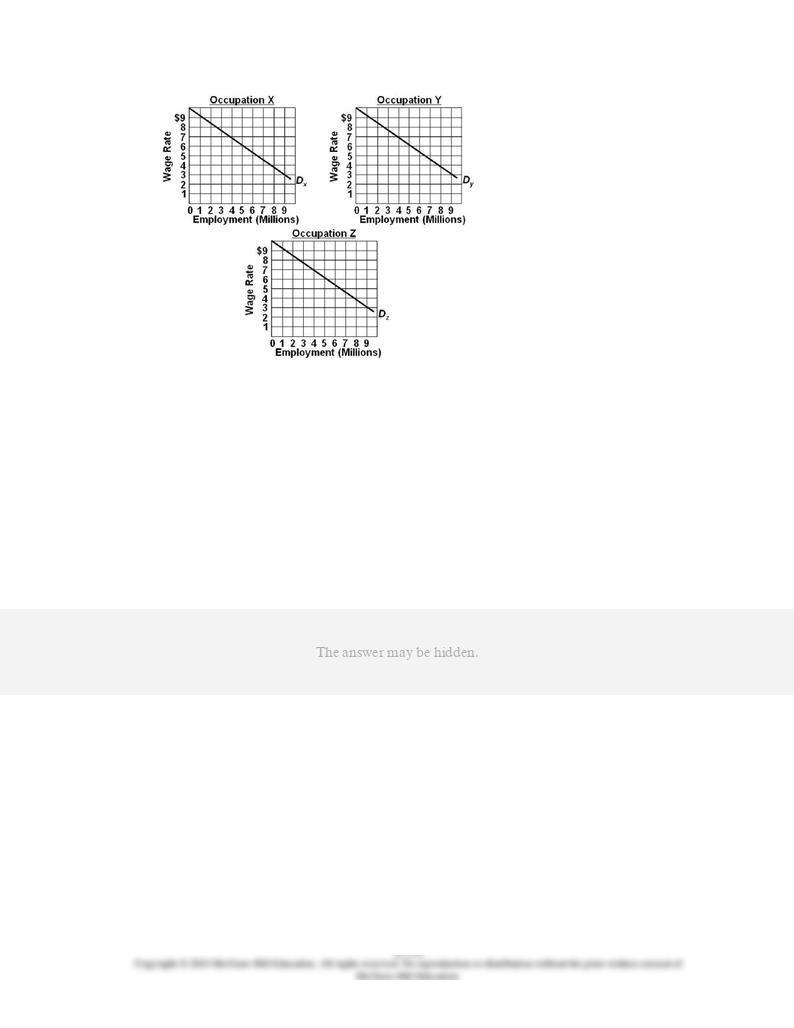
125.
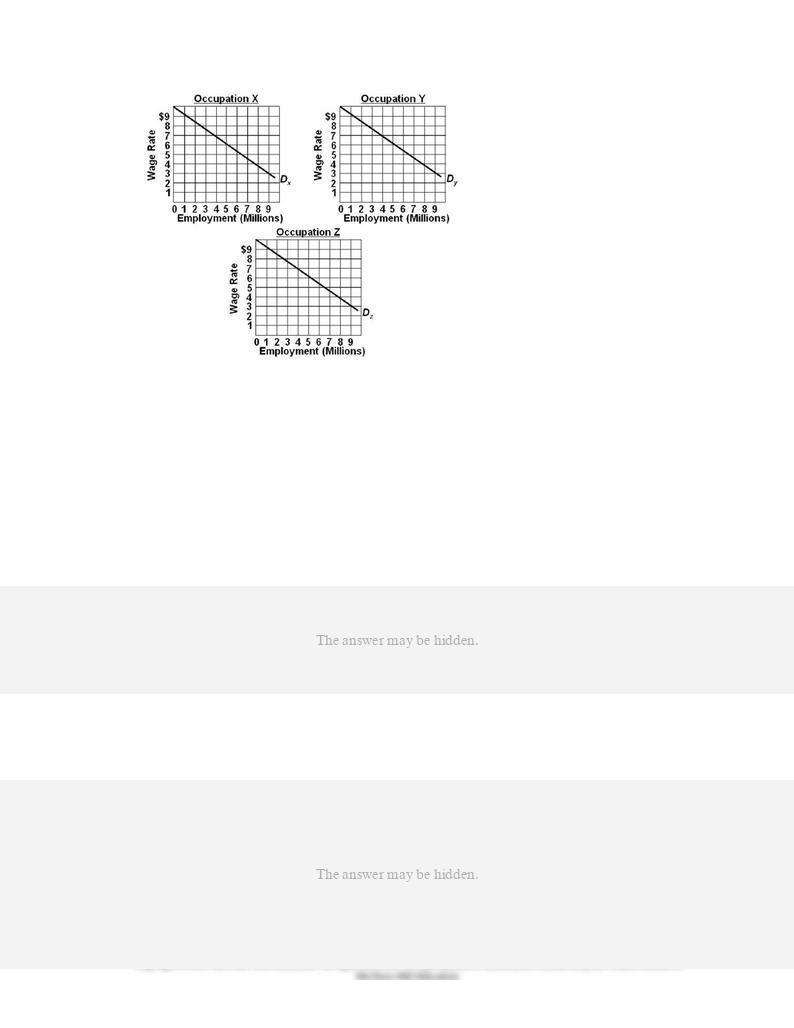
Assumptions: (1) the labor force is comprised of 9 million men and 9 million women workers;
(2) the economy has 3 occupations, X, Y, and Z, each having identical demand curves for
labor; (3) men and women workers are homogeneous with respect to their labor-market
capabilities; (4) women are discriminated against by being excluded from occupations X and
Y and are confined to Z; and (5) aside from discrimination, the economy is competitive, and
workers seek to maximize their earnings.
Refer to the diagram and list of assumptions. Under these circumstances 9 million women
will be employed in occupation Z:

126.
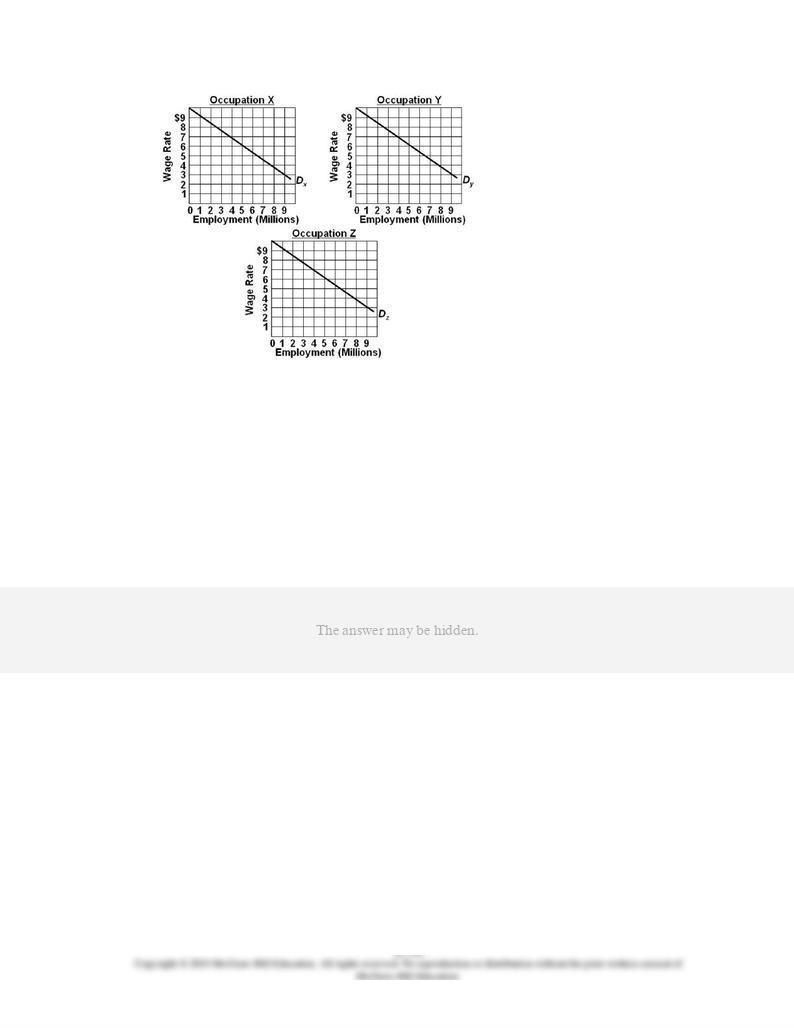
Assumptions: (1) the labor force is comprised of 9 million men and 9 million women workers;
(2) the economy has 3 occupations, X, Y, and Z, each having identical demand curves for
labor; (3) men and women workers are homogeneous with respect to their labor-market
capabilities; (4) women are discriminated against by being excluded from occupations X and
Y and are confined to Z; and (5) aside from discrimination, the economy is competitive, and
workers seek to maximize their earnings.
Refer to the diagram and list of assumptions. With women confined to occupation Z and men
free to choose occupations, how will this affect the wages paid?

127.
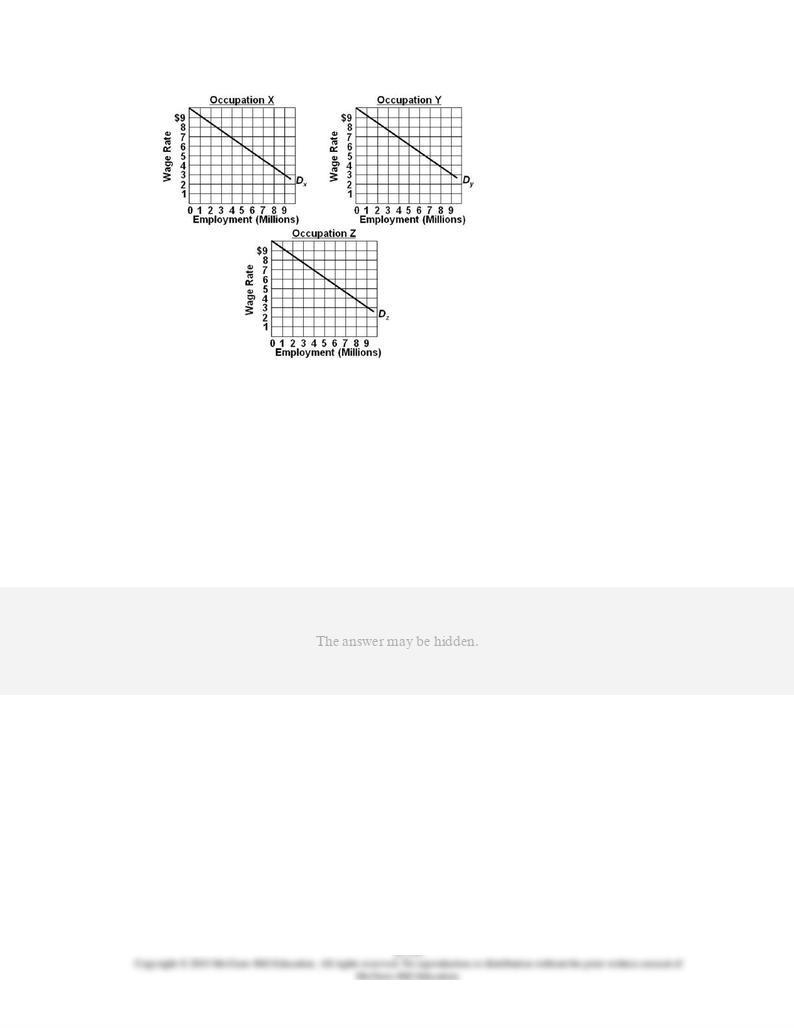
Assumptions: (1) the labor force is comprised of 9 million men and 9 million women workers;
(2) the economy has 3 occupations, X, Y, and Z, each having identical demand curves for
labor; (3) men and women workers are homogeneous with respect to their labor-market
capabilities; (4) women are discriminated against by being excluded from occupations X and
Y and are confined to Z; and (5) aside from discrimination, the economy is competitive, and
workers seek to maximize their earnings.
Refer to the diagram and list of assumptions. If discrimination is ended:

128.
Assumptions: (1) the labor force is comprised of 9 million men and 9 million women workers;
(2) the economy has 3 occupations, X, Y, and Z, each having identical demand curves for
labor; (3) men and women workers are homogeneous with respect to their labor-market
capabilities; (4) women are discriminated against by being excluded from occupations X and
Y and are confined to Z; and (5) aside from discrimination, the economy is competitive, and
workers seek to maximize their earnings.
Refer to the diagram and list of assumptions. If discrimination is ended, women:
129.
Assumptions: (1) the labor force is comprised of 9 million men and 9 million women workers;
(2) the economy has 3 occupations, X, Y, and Z, each having identical demand curves for
labor; (3) men and women workers are homogeneous with respect to their labor-market
capabilities; (4) women are discriminated against by being excluded from occupations X and
Y and are confined to Z; and (5) aside from discrimination, the economy is competitive, and
workers seek to maximize their earnings.
Refer to the diagram and list of assumptions. The elimination of gender discrimination:
130.
As applied to gender discrimination, the crowding model of occupational segregation:
131.
Discrimination creates a:
132.
Discrimination:
133.
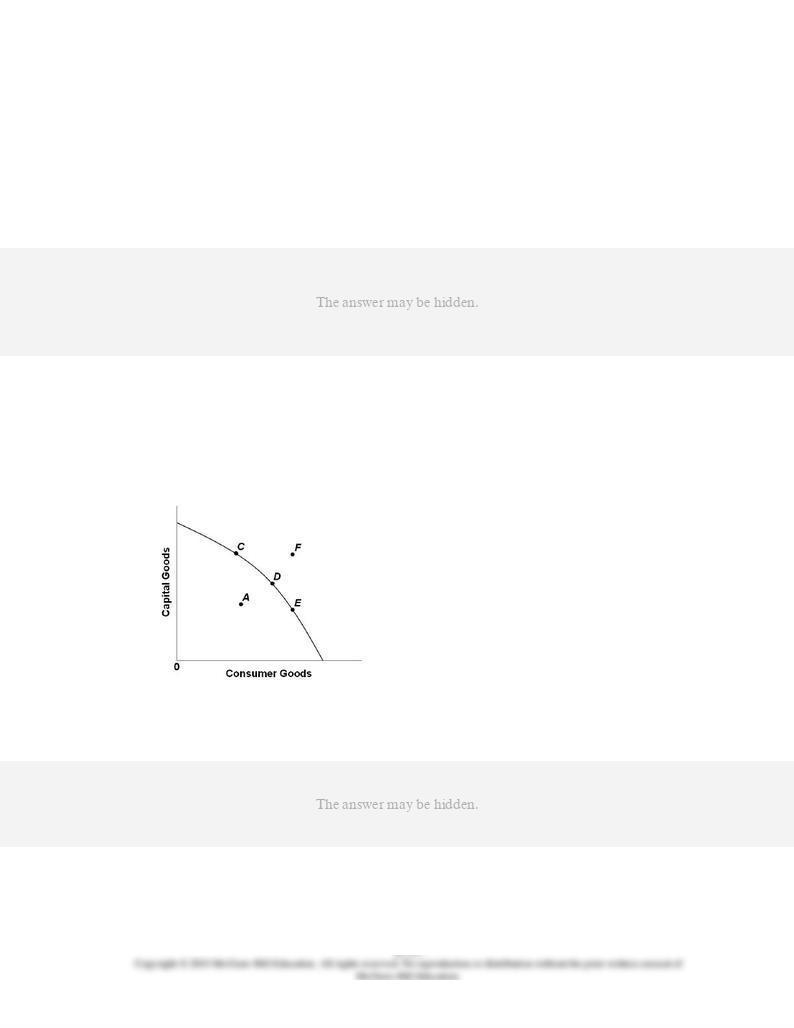
Economic discrimination puts the economy
inside
its production possibilities curve because
discrimination:
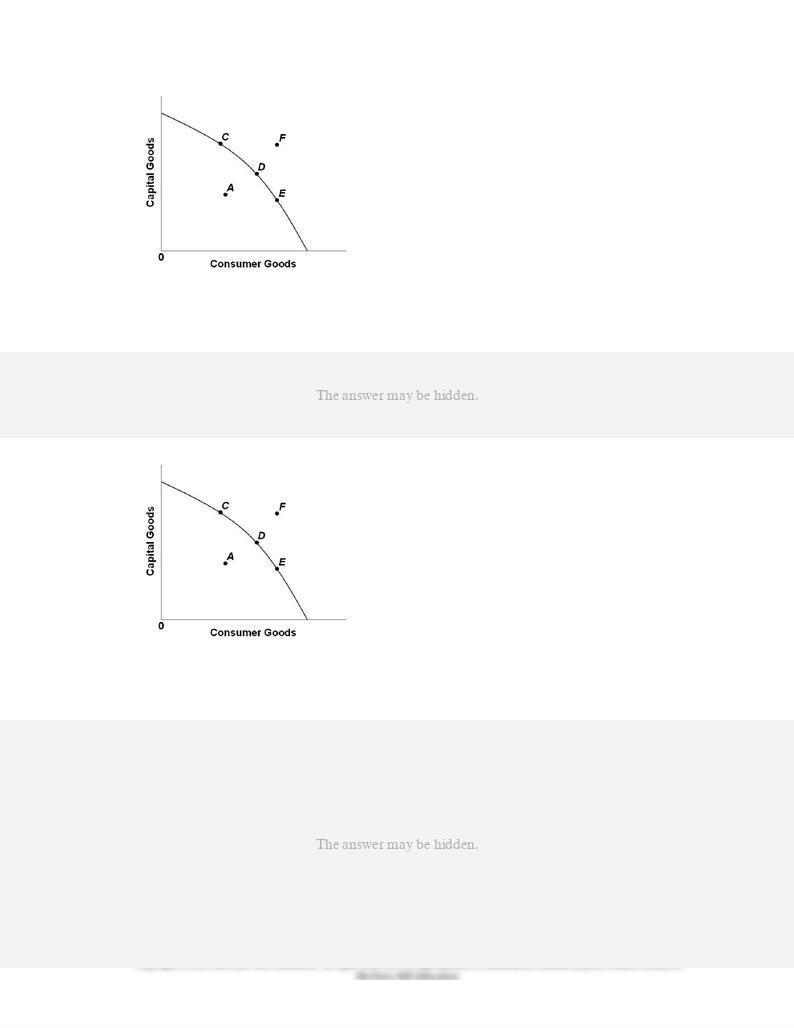
134.
In the diagram, economic discrimination is best represented by point:
135.
In the diagram, the elimination of discrimination is best represented by:

136.
(Consider This) According to economists Krueger and Perri:
137.
(Consider This) According to
The
Economist
magazine, growing income inequality is less of a
concern because:
138.
(Consider This) In "Slicing the Pizza," the shrinkage of the pizza refers to the:
139.
(Consider This) The main focus of the vignette "Slicing the Pizza" is the:

140.
(Last Word) Between 1995 and 2007 in the United States:
141.
(Last Word) In 2010, the wealthiest 1 percent of U.S. households held about ____ percent of
A.
35.
B.
77.
C.
23.
D.
32.
142.
(Last Word) Median wealth in the United States in 2010:
143.
Government transfer programs result in a U.S. Lorenz curve that is closer to the diagonal line
than would be the case without the programs.
144.
The closer the Lorenz curve is to the diagonal, the greater is the degree of income inequality.

145.
The standard data on income distribution do not include the value of noncash transfers as
income.
146.
A curve showing the quintile distribution of a nation's income is called the Gini curve.
147.
In the United States since 1975, the poor have gotten poorer and the rich have gotten richer
in both relative and absolute terms.
148.
The top 20 percent of U.S. income earners receive nearly 80 percent of total U.S. income.
149.
Currently over 90 percent of all workers in the United States are covered by Social Security.
150.
Unemployment compensation is financed by taxes levied on employers.
151.
TANF stands for Temporary Assistance for Needy Families.
152.
After the implementation of TANF, the U.S. welfare rolls fell by more than one-half between
1996 and 2007.
153.
The U.S. poverty rate for the elderly (65 and over) is higher than for the general population.

154.
The U.S. poverty rate was considerably lower in 2011 than in 1960.
155.
Labor market discrimination increases the size of the nation's GDP by promoting
specialization on the basis of race.
156.
An employer (biased against African Americans) whose discrimination coefficient is $5 will
hire only whites if the actual African-American-white wage gap is $7.
157.
A reduction in the collective discrimination coefficients of employers will increase the wage
rate of those discriminated against but reduce their employment.
158.
Statistical discrimination is also known as occupational discrimination.
159.
The crowding model of occupational segregation predicts that domestic output will increase
if occupational segregation is ended.

Chapter 21 Income Inequality, Poverty, and Discrimination Answer
Key
Multiple Choice Questions
1.
In 2011, the average income for households in the United States was about:
AACSB: Reflective Thinking
Accessibility: Keyboard Navigation
Blooms: Remember
Difficulty: 1 Easy
Learning Objective: 21-01 Explain how income inequality in the United States is measured and described.
Topic: Facts about income inequality
2.
In the quintile distribution of income, the term "quintile" represents:
AACSB: Analytic
Accessibility: Keyboard Navigation
Blooms: Remember
Difficulty: 1 Easy
Learning Objective: 21-01 Explain how income inequality in the United States is measured and described.
Topic: Facts about income inequality

3.
In 2011, a household with an annual income of $75,000 would find itself in the:
AACSB: Reflective Thinking
Accessibility: Keyboard Navigation
Blooms: Remember
Difficulty: 1 Easy
Learning Objective: 21-01 Explain how income inequality in the United States is measured and described.
Topic: Facts about income inequality
4.
In 2011, a household with an annual income of $23,000 would find itself in the:
AACSB: Reflective Thinking
Accessibility: Keyboard Navigation
Blooms: Remember
Difficulty: 1 Easy
Learning Objective: 21-01 Explain how income inequality in the United States is measured and described.
Topic: Facts about income inequality
5.
The lowest quintile of households in the income distribution receives about:
A.
2.4 percent of the total income.
C.
8.4 percent of the total income.
AACSB: Reflective Thinking
Accessibility: Keyboard Navigation
Blooms: Remember
Difficulty: 1 Easy
Learning Objective: 21-01 Explain how income inequality in the United States is measured and described.
Topic: Facts about income inequality
6.
The highest quintile of households in the income distribution:
AACSB: Analytic
Accessibility: Keyboard Navigation
Blooms: Remember
Difficulty: 1 Easy
Learning Objective: 21-01 Explain how income inequality in the United States is measured and described.
Topic: Facts about income inequality
7.
Answer the question on the basis of the following Census data.
Which of the given distributions is closest to describing the United States?
AACSB: Analytic
Blooms: Remember
Difficulty: 1 Easy
Learning Objective: 21-01 Explain how income inequality in the United States is measured and described.
Topic: Facts about income inequality
Type: Table

8.
In 2011, the highest quintile of households in the U.S. income distribution received about:
AACSB: Reflective Thinking
Accessibility: Keyboard Navigation
Blooms: Remember
Difficulty: 1 Easy
Learning Objective: 21-01 Explain how income inequality in the United States is measured and described.
Topic: Facts about income inequality
9.
Census data indicate that, as of 2011, the top fifth of all households receive about
________ times as much income as the bottom fifth.
AACSB: Analytic
Accessibility: Keyboard Navigation
Blooms: Remember
Difficulty: 1 Easy
Learning Objective: 21-01 Explain how income inequality in the United States is measured and described.
Topic: Facts about income inequality
10.
The Lorenz curve:
AACSB: Analytic

Accessibility: Keyboard Navigation
Blooms: Remember
Difficulty: 1 Easy
Learning Objective: 21-01 Explain how income inequality in the United States is measured and described.
Topic: Facts about income inequality
11.
The Lorenz curve portrays:
AACSB: Analytic
Accessibility: Keyboard Navigation
Blooms: Understand
Difficulty: 2 Medium
Learning Objective: 21-01 Explain how income inequality in the United States is measured and described.
Topic: Facts about income inequality
12.
The Gini ratio:
AACSB: Analytic
Accessibility: Keyboard Navigation
Blooms: Remember
Difficulty: 1 Easy
Learning Objective: 21-01 Explain how income inequality in the United States is measured and described.
Topic: Facts about income inequality
13.
The Gini ratio of income inequality ranges between:
AACSB: Analytic
Accessibility: Keyboard Navigation
Blooms: Remember
Difficulty: 1 Easy
Learning Objective: 21-01 Explain how income inequality in the United States is measured and described.
Topic: Facts about income inequality
14.
Refer to the diagram where curves (a) through (e) are Lorenz curves for five different
countries. Income is equally distributed in:
A.
none of the countries shown.
B.
country b.
C.
countries a and e.
AACSB: Reflective Thinking
Blooms: Apply
Difficulty: 2 Medium
Learning Objective: 21-01 Explain how income inequality in the United States is measured and described.
Topic: Facts about income inequality
Type: Graph

15.
Refer to the diagram where curves (a) through (e) are for five different countries. The Gini
ratio is lowest in country:
AACSB: Reflective Thinking
Blooms: Apply
Difficulty: 2 Medium
Learning Objective: 21-01 Explain how income inequality in the United States is measured and described.
Topic: Facts about income inequality
Type: Graph
16.
Refer to the diagram where curves (a) through (e) are for five different countries. Of the
countries listed below, income is most unequally distributed in country:
AACSB: Reflective Thinking
Blooms: Apply
Difficulty: 2 Medium
Learning Objective: 21-01 Explain how income inequality in the United States is measured and described.
Topic: Facts about income inequality
Type: Graph
17.
Refer to the diagram where curves (a) through (e) are for five different countries. The Gini
ratio is:
A.
zero in country (e) and 1 in country (a).
B.
greater in country (b) than in country (c).
AACSB: Analytic
Blooms: Apply
Difficulty: 2 Medium
Learning Objective: 21-01 Explain how income inequality in the United States is measured and described.
Topic: Facts about income inequality
Type: Graph
18.
Answer the question on the basis of the following information. Suppose the members of
population A, consisting of Al, Bob, Curt, Doris, and Ellie, receive annual incomes of
$5,000, $2,500, $1,250, $750, and $500, respectively.
Refer to the given information. What percentage of total income is received by the richest
quintile?
B.
5.
C.
25.
D.
20.
AACSB: Analytic
Accessibility: Keyboard Navigation

Blooms: Apply
Difficulty: 2 Medium
Learning Objective: 21-01 Explain how income inequality in the United States is measured and described.
Topic: Facts about income inequality
Type: Graph
19.
Answer the question on the basis of the following information. Suppose the members of
population A, consisting of Al, Bob, Curt, Doris, and Ellie, receive annual incomes of
$5,000, $2,500, $1,250, $750, and $500, respectively.
Refer to the given information. What percentage of total income is received by the lowest
60 percent of the income receivers in population A?
A.
60.
B.
50.
C.
25.
D.
20.
AACSB: Analytic
Accessibility: Keyboard Navigation
Blooms: Apply
Difficulty: 2 Medium
Learning Objective: 21-01 Explain how income inequality in the United States is measured and described.
Topic: Facts about income inequality
Type: Graph

20.
Answer the question on the basis of the following information. Suppose the members of
population A, consisting of Al, Bob, Curt, Doris, and Ellie, receive annual incomes of
$5,000, $2,500, $1,250, $750, and $500, respectively.
Refer to the given information and this information as well. The members of population B,
consisting of Fred, George, Holly, Irma, and Joan, receive incomes of $4,000, $3,000,
$1,250, $950, and $800, respectively. We:
A.
can say that the income of population B is less equally distributed than that of
population A.
B.
can say that the income of population B is more equally distributed than that of
AACSB: Analytic
Accessibility: Keyboard Navigation
Blooms: Apply
Difficulty: 2 Medium
Learning Objective: 21-01 Explain how income inequality in the United States is measured and described.
Topic: Facts about income inequality
Type: Graph
21.
The greater the area between the Lorenz curve and the diagonal in the Lorenz curve
diagram, the:
AACSB: Reflective Thinking
Accessibility: Keyboard Navigation
Blooms: Understand
Difficulty: 2 Medium
Learning Objective: 21-01 Explain how income inequality in the United States is measured and described.
Topic: Facts about income inequality

22.
Which of the following Gini ratios indicates the highest degree of income inequality?
B.
0.65.
C.
0.29.
D.
0.42.
AACSB: Analytic
Accessibility: Keyboard Navigation
Blooms: Apply
Difficulty: 2 Medium
Learning Objective: 21-01 Explain how income inequality in the United States is measured and described.
Topic: Facts about income inequality
23.
Which of the following Gini ratios indicates the lowest degree of income inequality?
A.
0.71.
B.
0.55.
D.
0.45.
AACSB: Analytic
Accessibility: Keyboard Navigation
Blooms: Apply
Difficulty: 2 Medium
Learning Objective: 21-01 Explain how income inequality in the United States is measured and described.
Topic: Facts about income inequality
24.
Which of the following countries has the highest Gini ratio, as of 2011?
A.
Italy.
B.
United States.
AACSB: Reflective Thinking
Accessibility: Keyboard Navigation
Blooms: Remember
Difficulty: 1 Easy
Learning Objective: 21-01 Explain how income inequality in the United States is measured and described.
Learning Objective: 21-02 Discuss the extent and sources of income inequality.
Topic: Causes of income inequality
Topic: Facts about income inequality
25.
The movement of individuals and households from one income quintile to another over
time is called:
AACSB: Analytic
Accessibility: Keyboard Navigation
Blooms: Remember
Difficulty: 1 Easy
Learning Objective: 21-01 Explain how income inequality in the United States is measured and described.
Learning Objective: 21-02 Discuss the extent and sources of income inequality.
Topic: Causes of income inequality
Topic: Facts about income inequality
26.
Income mobility:
AACSB: Analytic
Accessibility: Keyboard Navigation
Blooms: Remember
Difficulty: 1 Easy
Learning Objective: 21-01 Explain how income inequality in the United States is measured and described.
Learning Objective: 21-02 Discuss the extent and sources of income inequality.
Topic: Causes of income inequality
Topic: Facts about income inequality

27.
Income mobility:
AACSB: Reflective Thinking
Accessibility: Keyboard Navigation
Blooms: Remember
Difficulty: 1 Easy
Learning Objective: 21-01 Explain how income inequality in the United States is measured and described.
Learning Objective: 21-02 Discuss the extent and sources of income inequality.
Topic: Causes of income inequality
Topic: Facts about income inequality
28.
In the United States, the lifetime distribution of income is more equal than the annual
distribution. This statement is:
AACSB: Reflective Thinking
Accessibility: Keyboard Navigation
Blooms: Understand
Difficulty: 2 Medium
Learning Objective: 21-01 Explain how income inequality in the United States is measured and described.
Learning Objective: 21-02 Discuss the extent and sources of income inequality.
Topic: Causes of income inequality
Topic: Facts about income inequality

29.
People's incomes are relatively low when they are young, reach a peak in middle age, and
then decline. This fact helps explain:
AACSB: Reflective Thinking
Accessibility: Keyboard Navigation
Blooms: Understand
Difficulty: 2 Medium
Learning Objective: 21-01 Explain how income inequality in the United States is measured and described.
Learning Objective: 21-02 Discuss the extent and sources of income inequality.
Topic: Causes of income inequality
Topic: Facts about income inequality
30.
Some economists have criticized standard government figures on income inequality,
arguing that these data:
AACSB: Reflective Thinking
Accessibility: Keyboard Navigation
Blooms: Remember
Difficulty: 1 Easy
Learning Objective: 21-01 Explain how income inequality in the United States is measured and described.
Learning Objective: 21-02 Discuss the extent and sources of income inequality.
Topic: Causes of income inequality
Topic: Facts about income inequality

31.
In the United States:
AACSB: Reflective Thinking
Accessibility: Keyboard Navigation
Blooms: Understand
Difficulty: 2 Medium
Learning Objective: 21-01 Explain how income inequality in the United States is measured and described.
Learning Objective: 21-02 Discuss the extent and sources of income inequality.
Topic: Causes of income inequality
Topic: Facts about income inequality
32.
Housing subsidies for low-income households:
AACSB: Analytic
Accessibility: Keyboard Navigation
Blooms: Remember
Difficulty: 1 Easy
Learning Objective: 21-01 Explain how income inequality in the United States is measured and described.
Learning Objective: 21-02 Discuss the extent and sources of income inequality.
Topic: Causes of income inequality
Topic: Facts about income inequality
33.
Standard Census data on the distribution of income:
AACSB: Reflective Thinking
Accessibility: Keyboard Navigation
Blooms: Remember
Difficulty: 1 Easy
Learning Objective: 21-01 Explain how income inequality in the United States is measured and described.
Learning Objective: 21-02 Discuss the extent and sources of income inequality.
Topic: Causes of income inequality
Topic: Facts about income inequality
34.
Which of the following is a noncash transfer?
AACSB: Reflective Thinking
Accessibility: Keyboard Navigation
Blooms: Apply
Difficulty: 2 Medium
Learning Objective: 21-01 Explain how income inequality in the United States is measured and described.
Learning Objective: 21-02 Discuss the extent and sources of income inequality.
Topic: Causes of income inequality
Topic: Facts about income inequality
35.
Refer to the diagram. If line (c) represents the pretax and transfer distribution of income in
the United States, we would expect the post-tax and transfer distribution to be:
AACSB: Reflective Thinking
Blooms: Apply
Difficulty: 2 Medium
Learning Objective: 21-01 Explain how income inequality in the United States is measured and described.
Learning Objective: 21-02 Discuss the extent and sources of income inequality.
Topic: Causes of income inequality
Topic: Facts about income inequality
Type: Graph
36.
Refer to the diagram. If line (c) represents the distribution of income in 1975 in the United
States, we would expect the distribution of income for 2011 to be more like:
AACSB: Analytic
Blooms: Apply
Difficulty: 2 Medium
Learning Objective: 21-01 Explain how income inequality in the United States is measured and described.
Learning Objective: 21-03 Demonstrate how income inequality has changed since 1975.
Topic: Facts about income inequality
Topic: Income inequality over time
37.
Refer to the diagram. If line (c) represents the distribution of income before taxes and
transfers and line (b) represents the distribution after taxes and transfers, then taxes and
transfers have:
AACSB: Reflective Thinking
Blooms: Apply
Difficulty: 2 Medium
Learning Objective: 21-01 Explain how income inequality in the United States is measured and described.
Learning Objective: 21-02 Discuss the extent and sources of income inequality.
Topic: Causes of income inequality
Topic: Facts about income inequality
38.
Each of the following contributes to income inequality
except
:
AACSB: Analytic
Accessibility: Keyboard Navigation
Blooms: Remember
Difficulty: 1 Easy
Learning Objective: 21-02 Discuss the extent and sources of income inequality.
Topic: Causes of income inequality

39.
If discrimination based on gender and race was eliminated, we would expect the:
AACSB: Reflective Thinking
Accessibility: Keyboard Navigation
Blooms: Analyze
Difficulty: 3 Hard
Learning Objective: 21-02 Discuss the extent and sources of income inequality.
Topic: Causes of income inequality
40.
Differences in the amounts and quality of education and training:
AACSB: Reflective Thinking
Accessibility: Keyboard Navigation
Blooms: Understand
Difficulty: 2 Medium
Learning Objective: 21-02 Discuss the extent and sources of income inequality.
Topic: Causes of income inequality

41.
One cause of income inequality in the United States is:
AACSB: Analytic
Accessibility: Keyboard Navigation
Blooms: Understand
Difficulty: 2 Medium
Learning Objective: 21-02 Discuss the extent and sources of income inequality.
Topic: Causes of income inequality
42.
Which of the following would likely reduce income inequality?
AACSB: Reflective Thinking
Accessibility: Keyboard Navigation
Blooms: Apply
Difficulty: 2 Medium
Learning Objective: 21-02 Discuss the extent and sources of income inequality.
Topic: Causes of income inequality
43.
Income:
AACSB: Analytic
Accessibility: Keyboard Navigation
Blooms: Remember
Difficulty: 1 Easy
Learning Objective: 21-02 Discuss the extent and sources of income inequality.
Topic: Causes of income inequality
44.
Wealth:
AACSB: Analytic
Accessibility: Keyboard Navigation
Blooms: Remember
Difficulty: 1 Easy
Learning Objective: 21-02 Discuss the extent and sources of income inequality.
Topic: Causes of income inequality
45.
Which of the following is
correct
?
AACSB: Analytic
Accessibility: Keyboard Navigation
Blooms: Remember
Difficulty: 1 Easy
Learning Objective: 21-02 Discuss the extent and sources of income inequality.
Topic: Causes of income inequality

46.
Wealth in the United States is:
AACSB: Reflective Thinking
Accessibility: Keyboard Navigation
Blooms: Remember
Difficulty: 1 Easy
Learning Objective: 21-02 Discuss the extent and sources of income inequality.
Topic: Causes of income inequality
47.
The distribution of wealth in the United States is such that it:
AACSB: Reflective Thinking
Accessibility: Keyboard Navigation
Blooms: Understand
Difficulty: 2 Medium
Learning Objective: 21-02 Discuss the extent and sources of income inequality.
Topic: Causes of income inequality

48.
Which is
correct
?
AACSB: Reflective Thinking
Accessibility: Keyboard Navigation
Blooms: Understand
Difficulty: 2 Medium
Learning Objective: 21-02 Discuss the extent and sources of income inequality.
Topic: Causes of income inequality
49.
The exercise of market power by suppliers in resource markets tends to:
AACSB: Reflective Thinking
Accessibility: Keyboard Navigation
Blooms: Understand
Difficulty: 2 Medium
Learning Objective: 21-02 Discuss the extent and sources of income inequality.
Topic: Causes of income inequality

50.
Each of the following has contributed to growing income inequality in the United States
since 1975
except
:
AACSB: Analytic
Accessibility: Keyboard Navigation
Blooms: Remember
Difficulty: 1 Easy
Learning Objective: 21-02 Discuss the extent and sources of income inequality.
Topic: Causes of income inequality
51.
Which of the following would most likely increase income inequality?
AACSB: Reflective Thinking
Accessibility: Keyboard Navigation
Blooms: Understand
Difficulty: 2 Medium
Learning Objective: 21-02 Discuss the extent and sources of income inequality.
Topic: Causes of income inequality
52.
Since 1975 the distribution of income has:
AACSB: Reflective Thinking
Accessibility: Keyboard Navigation
Blooms: Remember

Difficulty: 1 Easy
Learning Objective: 21-03 Demonstrate how income inequality has changed since 1975.
Topic: Income inequality over time
53.
Which of the following helps explain growing income inequality in the United States in
recent years?
AACSB: Reflective Thinking
Accessibility: Keyboard Navigation
Blooms: Understand
Difficulty: 2 Medium
Learning Objective: 21-03 Demonstrate how income inequality has changed since 1975.
Topic: Income inequality over time
54.
The term "growing income inequality" implies that the:
AACSB: Reflective Thinking
Accessibility: Keyboard Navigation
Blooms: Understand
Difficulty: 2 Medium
Learning Objective: 21-03 Demonstrate how income inequality has changed since 1975.
Topic: Income inequality over time

55.
Since 1980 the difference between the earnings of college graduates and high school
graduates has:
AACSB: Reflective Thinking
Accessibility: Keyboard Navigation
Blooms: Remember
Difficulty: 1 Easy
Learning Objective: 21-03 Demonstrate how income inequality has changed since 1975.
Topic: Income inequality over time
56.
The entrance of large numbers of "baby boomers" into the labor force in the 1970s and
1980s:
AACSB: Reflective Thinking
Accessibility: Keyboard Navigation
Blooms: Remember
Difficulty: 1 Easy
Learning Objective: 21-03 Demonstrate how income inequality has changed since 1975.
Topic: Income inequality over time

57.
The basic argument for income inequality is that:
AACSB: Reflective Thinking
Accessibility: Keyboard Navigation
Blooms: Understand
Difficulty: 2 Medium
Learning Objective: 21-04 Debate the economic arguments for and against income inequality.
Topic: Equality versus efficiency
58.
The basic economic argument for greater income equality is that:
AACSB: Reflective Thinking
Accessibility: Keyboard Navigation
Blooms: Understand
Difficulty: 2 Medium
Learning Objective: 21-04 Debate the economic arguments for and against income inequality.
Topic: Equality versus efficiency
59.
Refer to the diagrams that show identical marginal utility from income curves for Singer
and Catalano. The marginal utility from income curves are drawn on the assumption that:
AACSB: Reflective Thinking
Blooms: Apply
Difficulty: 2 Medium
Learning Objective: 21-04 Debate the economic arguments for and against income inequality.
Topic: Equality versus efficiency
Type: Graph
60.
Refer to the diagrams that show identical marginal utility from income curves for Singer
and Catalano. If a given income of $20,000 is initially distributed so that Singer receives
$15,000 and Catalano $5,000, the marginal utility:
AACSB: Reflective Thinking
Blooms: Apply
Difficulty: 2 Medium
Learning Objective: 21-04 Debate the economic arguments for and against income inequality.
Topic: Equality versus efficiency
Type: Graph
61.
Refer to the diagrams that show identical marginal utility from income curves for Singer
and Catalano. If a given income of $20,000 is initially distributed so that Singer receives
$15,000 and Catalano $5,000:
AACSB: Reflective Thinking
Blooms: Analyze
Difficulty: 3 Hard
Learning Objective: 21-04 Debate the economic arguments for and against income inequality.
Topic: Equality versus efficiency
Type: Graph

62.
Refer to the diagrams that show identical marginal utility from income curves for Singer
and Catalano. If an initial distribution of $15,000 to Singer and $5,000 to Catalano is
altered in favor of greater equality, it may be argued that:
AACSB: Reflective Thinking
Blooms: Analyze
Difficulty: 3 Hard
Learning Objective: 21-04 Debate the economic arguments for and against income inequality.
Topic: Equality versus efficiency
Type: Graph
63.
The equality-efficiency trade-off refers to:
AACSB: Reflective Thinking
Accessibility: Keyboard Navigation
Blooms: Understand

Difficulty: 2 Medium
Learning Objective: 21-04 Debate the economic arguments for and against income inequality.
Topic: Equality versus efficiency
64.
The equality-efficiency trade-off suggests that:
AACSB: Reflective Thinking
Accessibility: Keyboard Navigation
Blooms: Understand
Difficulty: 2 Medium
Learning Objective: 21-04 Debate the economic arguments for and against income inequality.
Topic: Equality versus efficiency
65.
Gomez argues that we need to increase the nation's output. Chang contends that our top
priority should be a more equal distribution of income and output. It can be correctly
stated that these two goals are:
AACSB: Reflective Thinking
Accessibility: Keyboard Navigation
Blooms: Apply
Difficulty: 2 Medium
Learning Objective: 21-04 Debate the economic arguments for and against income inequality.
Topic: Equality versus efficiency

66.
According to the standard government definitions, the percentage of the U.S. population
B.
20.5 percent.
C.
9.8 percent.
D.
13.2 percent.
AACSB: Reflective Thinking
Accessibility: Keyboard Navigation
Blooms: Remember
Difficulty: 1 Easy
Learning Objective: 21-05 Relate how poverty is measured and its incidence by age; gender; ethnicity; and other
characteristics.
Topic: Economics of poverty
67.
In 2011, the official poverty line for a household of four in the United States was:
AACSB: Reflective Thinking
Accessibility: Keyboard Navigation
Blooms: Remember
Difficulty: 1 Easy
Learning Objective: 21-05 Relate how poverty is measured and its incidence by age; gender; ethnicity; and other
characteristics.
Topic: Economics of poverty

68.
Which of the following demographic groups does
not
bear a disproportionate burden of
poverty?
AACSB: Reflective Thinking
Accessibility: Keyboard Navigation
Blooms: Remember
Difficulty: 1 Easy
Learning Objective: 21-05 Relate how poverty is measured and its incidence by age; gender; ethnicity; and other
characteristics.
Topic: Economics of poverty
69.
The poverty rate in the United States was:
AACSB: Reflective Thinking
Accessibility: Keyboard Navigation
Blooms: Remember
Difficulty: 1 Easy
Learning Objective: 21-05 Relate how poverty is measured and its incidence by age; gender; ethnicity; and other
characteristics.
Topic: Economics of poverty
70.
Which of the following groups has the
highest
poverty rate?
AACSB: Reflective Thinking
Accessibility: Keyboard Navigation
Blooms: Remember
Difficulty: 1 Easy
Learning Objective: 21-05 Relate how poverty is measured and its incidence by age; gender; ethnicity; and other
characteristics.
Topic: Economics of poverty
71.
Which of the following groups has the
lowest
poverty rate?
AACSB: Reflective Thinking
Accessibility: Keyboard Navigation
Blooms: Remember
Difficulty: 1 Easy
Learning Objective: 21-05 Relate how poverty is measured and its incidence by age; gender; ethnicity; and other
characteristics.
Topic: Economics of poverty
72.
The poverty rate for African Americans is:
AACSB: Reflective Thinking
Accessibility: Keyboard Navigation
Blooms: Remember
Difficulty: 1 Easy
Learning Objective: 21-05 Relate how poverty is measured and its incidence by age; gender; ethnicity; and other
characteristics.
Topic: Economics of poverty

73.
Which of the following would we expect to have the highest poverty rate?
AACSB: Reflective Thinking
Accessibility: Keyboard Navigation
Blooms: Apply
Difficulty: 2 Medium
Learning Objective: 21-05 Relate how poverty is measured and its incidence by age; gender; ethnicity; and other
characteristics.
Topic: Economics of poverty
74.
The U.S. poverty rate for:
AACSB: Reflective Thinking
Accessibility: Keyboard Navigation
Blooms: Remember
Difficulty: 1 Easy
Learning Objective: 21-05 Relate how poverty is measured and its incidence by age; gender; ethnicity; and other
characteristics.
Topic: Economics of poverty

75.
Which of the following measurement issues makes interpretation of U.S. poverty rates
difficult?
AACSB: Reflective Thinking
Accessibility: Keyboard Navigation
Blooms: Understand
Difficulty: 2 Medium
Learning Objective: 21-05 Relate how poverty is measured and its incidence by age; gender; ethnicity; and other
characteristics.
Topic: Economics of poverty
76.
Which of the following measurement issues makes interpretation of U.S. poverty rates
difficult?
AACSB: Reflective Thinking
Accessibility: Keyboard Navigation
Blooms: Understand
Difficulty: 2 Medium
Learning Objective: 21-05 Relate how poverty is measured and its incidence by age; gender; ethnicity; and other
characteristics.
Topic: Economics of poverty

77.
A major difference between social insurance and welfare is that social insurance:
AACSB: Reflective Thinking
Accessibility: Keyboard Navigation
Blooms: Understand
Difficulty: 2 Medium
Learning Objective: 21-06 Identify the major components of the income-maintenance program in the United States.
Topic: U.S. income-maintenance system
78.
The U.S. income-maintenance program consists of two kinds of programs. They are:
AACSB: Analytic
Accessibility: Keyboard Navigation
Blooms: Remember
Difficulty: 1 Easy
Learning Objective: 21-06 Identify the major components of the income-maintenance program in the United States.
Topic: U.S. income-maintenance system

79.
An example of a social insurance program is ____________, whereas an example of a public
assistance program is _______.
AACSB: Reflective Thinking
Accessibility: Keyboard Navigation
Blooms: Remember
Difficulty: 1 Easy
Learning Objective: 21-06 Identify the major components of the income-maintenance program in the United States.
Topic: U.S. income-maintenance system
80.
Which of the following is
not
a social insurance program?
AACSB: Analytic
Accessibility: Keyboard Navigation
Blooms: Remember
Difficulty: 1 Easy
Learning Objective: 21-06 Identify the major components of the income-maintenance program in the United States.
Topic: U.S. income-maintenance system
81.
Which of the following is a public assistance or welfare program as opposed to a social
insurance program?
AACSB: Analytic

Accessibility: Keyboard Navigation
Blooms: Remember
Difficulty: 1 Easy
Learning Objective: 21-06 Identify the major components of the income-maintenance program in the United States.
Topic: U.S. income-maintenance system
82.
A major difference between social insurance and public assistance is that the:
AACSB: Reflective Thinking
Accessibility: Keyboard Navigation
Blooms: Understand
Difficulty: 2 Medium
Learning Objective: 21-06 Identify the major components of the income-maintenance program in the United States.
Topic: U.S. income-maintenance system
83.
Social Security is financed:
AACSB: Analytic
Accessibility: Keyboard Navigation
Blooms: Remember
Difficulty: 1 Easy
Learning Objective: 21-06 Identify the major components of the income-maintenance program in the United States.
Topic: U.S. income-maintenance system

84.
The primary purpose of Social Security is to:
AACSB: Reflective Thinking
Accessibility: Keyboard Navigation
Blooms: Understand
Difficulty: 2 Medium
Learning Objective: 21-06 Identify the major components of the income-maintenance program in the United States.
Topic: U.S. income-maintenance system
85.
For which of the following income-maintenance programs is aggregate spending the
greatest?
AACSB: Reflective Thinking
Accessibility: Keyboard Navigation
Blooms: Remember
Difficulty: 1 Easy
Learning Objective: 21-06 Identify the major components of the income-maintenance program in the United States.
Topic: U.S. income-maintenance system

86.
Medicaid:
AACSB: Analytic
Accessibility: Keyboard Navigation
Blooms: Remember
Difficulty: 1 Easy
Learning Objective: 21-06 Identify the major components of the income-maintenance program in the United States.
Topic: U.S. income-maintenance system
87.
Which of the following terms describes a system of subsidized health insurance available
to the aged?
AACSB: Analytic
Accessibility: Keyboard Navigation
Blooms: Remember
Difficulty: 1 Easy
Learning Objective: 21-06 Identify the major components of the income-maintenance program in the United States.
Topic: U.S. income-maintenance system

88.
Which of the following provides public assistance to those who are blind and otherwise
disabled?
AACSB: Analytic
Accessibility: Keyboard Navigation
Blooms: Remember
Difficulty: 1 Easy
Learning Objective: 21-06 Identify the major components of the income-maintenance program in the United States.
Topic: U.S. income-maintenance system
89.
Which of the following helps finance the medical expenses of individuals receiving TANF
or SSI?
AACSB: Analytic
Accessibility: Keyboard Navigation
Blooms: Remember
Difficulty: 1 Easy
Learning Objective: 21-06 Identify the major components of the income-maintenance program in the United States.
Topic: U.S. income-maintenance system

90.
The earned-income tax credit:
AACSB: Analytic
Accessibility: Keyboard Navigation
Blooms: Remember
Difficulty: 1 Easy
Learning Objective: 21-06 Identify the major components of the income-maintenance program in the United States.
Topic: U.S. income-maintenance system
91.
All but which one of the following are cash transfer programs?
AACSB: Analytic
Accessibility: Keyboard Navigation
Blooms: Remember
Difficulty: 1 Easy
Learning Objective: 21-06 Identify the major components of the income-maintenance program in the United States.
Topic: U.S. income-maintenance system
92.
Which one of the following would
increase
income inequality as measured by official
Census data and the quintile distribution?
AACSB: Reflective Thinking

Accessibility: Keyboard Navigation
Blooms: Analyze
Difficulty: 3 Hard
Learning Objective: 21-06 Identify the major components of the income-maintenance program in the United States.
Topic: U.S. income-maintenance system
93.
Which of the following would move the Lorenz curve closer to the diagonal?
AACSB: Reflective Thinking
Accessibility: Keyboard Navigation
Blooms: Analyze
Difficulty: 3 Hard
Learning Objective: 21-06 Identify the major components of the income-maintenance program in the United States.
Topic: U.S. income-maintenance system
94.
The TANF program:
AACSB: Reflective Thinking
Accessibility: Keyboard Navigation
Blooms: Remember
Difficulty: 1 Easy
Learning Objective: 21-06 Identify the major components of the income-maintenance program in the United States.
Topic: U.S. income-maintenance system

95.
The TANF program is designed to:
AACSB: Reflective Thinking
Accessibility: Keyboard Navigation
Blooms: Understand
Difficulty: 2 Medium
Learning Objective: 21-06 Identify the major components of the income-maintenance program in the United States.
Topic: U.S. income-maintenance system
96.
Since its inception in 1996, the Temporary Assistance for Needy Families (TANF) program
has:
AACSB: Reflective Thinking
Accessibility: Keyboard Navigation
Blooms: Remember
Difficulty: 1 Easy
Learning Objective: 21-06 Identify the major components of the income-maintenance program in the United States.
Topic: U.S. income-maintenance system
97.
By December 2009, the recession that began in December 2007:
AACSB: Reflective Thinking

Accessibility: Keyboard Navigation
Blooms: Remember
Difficulty: 1 Easy
Learning Objective: 21-06 Identify the major components of the income-maintenance program in the United States.
Topic: U.S. income-maintenance system
98.
The Supplemental Nutrition Assistance Program (SNAP):
AACSB: Reflective Thinking
Accessibility: Keyboard Navigation
Blooms: Remember
Difficulty: 1 Easy
Learning Objective: 21-06 Identify the major components of the income-maintenance program in the United States.
Topic: U.S. income-maintenance system
99.
African-American worker Jackson earns $30,000 per year; white worker Johnson earns
$40,000 per year. On the basis of this information we can conclude that:
AACSB: Reflective Thinking
Accessibility: Keyboard Navigation
Blooms: Analyze
Difficulty: 3 Hard
Learning Objective: 21-07 Discuss labor market discrimination and how it might affect hiring decisions and wages.
Topic: Economic analysis of discrimination

100.
For an employer biased against African Americans, the discrimination coefficient
d
:
AACSB: Analytic
Accessibility: Keyboard Navigation
Blooms: Remember
Difficulty: 1 Easy
Learning Objective: 21-07 Discuss labor market discrimination and how it might affect hiring decisions and wages.
Topic: Economic analysis of discrimination
101.
Which of the following employers is the most prejudiced? Employer:
AACSB: Analytic
Accessibility: Keyboard Navigation
Blooms: Understand
Difficulty: 2 Medium
Learning Objective: 21-07 Discuss labor market discrimination and how it might affect hiring decisions and wages.
Topic: Economic analysis of discrimination
102.
In the taste-for-discrimination model:
AACSB: Reflective Thinking

Accessibility: Keyboard Navigation
Blooms: Understand
Difficulty: 2 Medium
Learning Objective: 21-07 Discuss labor market discrimination and how it might affect hiring decisions and wages.
Topic: Economic analysis of discrimination
103.
Assume that all workers are equally productive, but the wage rate for men is $12
compared to $9 for women. An employer who employs only male workers must have a
discrimination coefficient of:
D.
1.33 or less.
AACSB: Analytic
Accessibility: Keyboard Navigation
Blooms: Apply
Difficulty: 2 Medium
Learning Objective: 21-07 Discuss labor market discrimination and how it might affect hiring decisions and wages.
Topic: Economic analysis of discrimination
104.
An employer whose discrimination coefficient is $4 will:
AACSB: Analytic
Accessibility: Keyboard Navigation
Blooms: Analyze
Difficulty: 3 Hard
Learning Objective: 21-07 Discuss labor market discrimination and how it might affect hiring decisions and wages.
Topic: Economic analysis of discrimination

105.
Suppose an employer is biased against African Americans. If his discrimination coefficient
is $2, the employer will:
AACSB: Analytic
Accessibility: Keyboard Navigation
Blooms: Analyze
Difficulty: 3 Hard
Learning Objective: 21-07 Discuss labor market discrimination and how it might affect hiring decisions and wages.
Topic: Economic analysis of discrimination
106.
If there is a widespread bias against African-American workers, an increase in the
collective discrimination coefficients of employers will:
AACSB: Reflective Thinking
Accessibility: Keyboard Navigation
Blooms: Analyze
Difficulty: 3 Hard
Learning Objective: 21-07 Discuss labor market discrimination and how it might affect hiring decisions and wages.
Topic: Economic analysis of discrimination

107.
In a labor market generally biased against Hispanics, a reduction in the collective
discrimination coefficients of employers will:
AACSB: Reflective Thinking
Accessibility: Keyboard Navigation
Blooms: Analyze
Difficulty: 3 Hard
Learning Objective: 21-07 Discuss labor market discrimination and how it might affect hiring decisions and wages.
Topic: Economic analysis of discrimination
108.
Refer to the diagram. Which of the following would be consistent with an
increase
in racial
prejudice against African Americans and thus an increase in the discrimination
coefficients of employers, taken as a group?
2 to
3.
2 to
1.
2 to
3.
1 to
2.
AACSB: Reflective Thinking
Blooms: Analyze
Difficulty: 3 Hard
Learning Objective: 21-07 Discuss labor market discrimination and how it might affect hiring decisions and wages.
Topic: Economic analysis of discrimination
Type: Graph
109.
Refer to the diagram. Which of the following would be consistent with a
decrease
in racial
prejudice against African Americans and thus a decrease in the discrimination coefficients
of employers, taken as a group?
3 to
2.
1 to
2.
3 to
2.
2 to
1.
AACSB: Reflective Thinking
Blooms: Analyze
Difficulty: 3 Hard
Learning Objective: 21-07 Discuss labor market discrimination and how it might affect hiring decisions and wages.
Topic: Economic analysis of discrimination
Type: Graph
110.
In the taste-for-discrimination model:
AACSB: Reflective Thinking
Accessibility: Keyboard Navigation
Blooms: Understand
Difficulty: 2 Medium

Learning Objective: 21-07 Discuss labor market discrimination and how it might affect hiring decisions and wages.
Topic: Economic analysis of discrimination
111.
An implication of the taste-for-discrimination model is that:
AACSB: Reflective Thinking
Accessibility: Keyboard Navigation
Blooms: Understand
Difficulty: 2 Medium
Learning Objective: 21-07 Discuss labor market discrimination and how it might affect hiring decisions and wages.
Topic: Economic analysis of discrimination
112.
An employer is prejudiced, prefers to hire white rather than Hispanic workers, and is
willing to pay higher wages to obtain white workers. This illustrates:
AACSB: Reflective Thinking
Accessibility: Keyboard Navigation
Blooms: Apply
Difficulty: 2 Medium
Learning Objective: 21-07 Discuss labor market discrimination and how it might affect hiring decisions and wages.
Topic: Economic analysis of discrimination

113.
Statistical discrimination refers to:
AACSB: Analytic
Accessibility: Keyboard Navigation
Blooms: Remember
Difficulty: 1 Easy
Learning Objective: 21-07 Discuss labor market discrimination and how it might affect hiring decisions and wages.
Topic: Economic analysis of discrimination
114.
Statistical discrimination:
AACSB: Reflective Thinking
Accessibility: Keyboard Navigation
Blooms: Understand
Difficulty: 2 Medium
Learning Objective: 21-07 Discuss labor market discrimination and how it might affect hiring decisions and wages.
Topic: Economic analysis of discrimination

115.
Insurance companies require male drivers under age 25 to pay higher insurance rates than
female drivers under age 25. Craig Raymond, however, is a safer driver than the average
female driver under age 25. Craig's higher insurance rate reflects:
AACSB: Reflective Thinking
Accessibility: Keyboard Navigation
Blooms: Apply
Difficulty: 2 Medium
Learning Objective: 21-07 Discuss labor market discrimination and how it might affect hiring decisions and wages.
Topic: Economic analysis of discrimination
116.
Statistical discrimination:
AACSB: Reflective Thinking
Accessibility: Keyboard Navigation
Blooms: Understand
Difficulty: 2 Medium
Learning Objective: 21-07 Discuss labor market discrimination and how it might affect hiring decisions and wages.
Topic: Economic analysis of discrimination

117.
Which of the following is an example of statistical discrimination?
AACSB: Reflective Thinking
Accessibility: Keyboard Navigation
Blooms: Apply
Difficulty: 2 Medium
Learning Objective: 21-07 Discuss labor market discrimination and how it might affect hiring decisions and wages.
Topic: Economic analysis of discrimination
118.
Suppose Gigantic Health Cooperative doesn't hire Mandy Morrison solely because she is a
graduate of a particular foreign medical school, which is not known for the high quality of
its graduates. Yet, Mandy is actually more qualified than the average graduate of
American medical schools. This is an example of:
AACSB: Reflective Thinking
Accessibility: Keyboard Navigation
Blooms: Apply
Difficulty: 2 Medium
Learning Objective: 21-07 Discuss labor market discrimination and how it might affect hiring decisions and wages.
Topic: Economic analysis of discrimination

119.
Suppose Copernicus Corporation hires Damon Danielson rather than Elmer Ellison, simply
because Damon is a graduate of an Ivy League school while Elmer is a graduate of a small
public university. Elmer is actually more qualified than Damon. This is an example of:
AACSB: Reflective Thinking
Accessibility: Keyboard Navigation
Blooms: Apply
Difficulty: 2 Medium
Learning Objective: 21-07 Discuss labor market discrimination and how it might affect hiring decisions and wages.
Topic: Economic analysis of discrimination
120.
A particular woman is denied on-the-job training because women on average are more
likely to drop out of the workforce than men. This illustrates:
AACSB: Reflective Thinking
Accessibility: Keyboard Navigation
Blooms: Apply
Difficulty: 2 Medium
Learning Objective: 21-07 Discuss labor market discrimination and how it might affect hiring decisions and wages.
Topic: Economic analysis of discrimination

121.
The crowding model of discrimination suggests that:
AACSB: Analytic
Accessibility: Keyboard Navigation
Blooms: Remember
Difficulty: 1 Easy
Learning Objective: 21-07 Discuss labor market discrimination and how it might affect hiring decisions and wages.
Topic: Economic analysis of discrimination
122.
The crowding of women and minorities into a restricted number of occupations:
AACSB: Reflective Thinking
Accessibility: Keyboard Navigation
Blooms: Understand
Difficulty: 2 Medium
Learning Objective: 21-07 Discuss labor market discrimination and how it might affect hiring decisions and wages.
Topic: Economic analysis of discrimination

123.
Minority workers are underrepresented and have less access to certain high-paying
occupations. This illustrates:
AACSB: Reflective Thinking
Accessibility: Keyboard Navigation
Blooms: Understand
Difficulty: 2 Medium
Learning Objective: 21-07 Discuss labor market discrimination and how it might affect hiring decisions and wages.
Topic: Economic analysis of discrimination
124.
The crowding model is primarily concerned with explaining:
AACSB: Analytic
Accessibility: Keyboard Navigation
Blooms: Understand
Difficulty: 2 Medium
Learning Objective: 21-07 Discuss labor market discrimination and how it might affect hiring decisions and wages.
Topic: Economic analysis of discrimination

125.
Assumptions: (1) the labor force is comprised of 9 million men and 9 million women
workers; (2) the economy has 3 occupations, X, Y, and Z, each having identical demand
curves for labor; (3) men and women workers are homogeneous with respect to their
labor-market capabilities; (4) women are discriminated against by being excluded from
occupations X and Y and are confined to Z; and (5) aside from discrimination, the
economy is competitive, and workers seek to maximize their earnings.
Refer to the diagram and list of assumptions. Under these circumstances 9 million women
will be employed in occupation Z:
AACSB: Analytic
Blooms: Analyze
Difficulty: 3 Hard
Learning Objective: 21-07 Discuss labor market discrimination and how it might affect hiring decisions and wages.
Topic: Economic analysis of discrimination
Type: Graph
126.
Assumptions: (1) the labor force is comprised of 9 million men and 9 million women
workers; (2) the economy has 3 occupations, X, Y, and Z, each having identical demand
curves for labor; (3) men and women workers are homogeneous with respect to their
labor-market capabilities; (4) women are discriminated against by being excluded from
occupations X and Y and are confined to Z; and (5) aside from discrimination, the
economy is competitive, and workers seek to maximize their earnings.
Refer to the diagram and list of assumptions. With women confined to occupation Z and
men free to choose occupations, how will this affect the wages paid?
AACSB: Analytic
Blooms: Analyze
Difficulty: 3 Hard
Learning Objective: 21-07 Discuss labor market discrimination and how it might affect hiring decisions and wages.
Topic: Economic analysis of discrimination
Type: Graph

127.
Assumptions: (1) the labor force is comprised of 9 million men and 9 million women
workers; (2) the economy has 3 occupations, X, Y, and Z, each having identical demand
curves for labor; (3) men and women workers are homogeneous with respect to their
labor-market capabilities; (4) women are discriminated against by being excluded from
occupations X and Y and are confined to Z; and (5) aside from discrimination, the
economy is competitive, and workers seek to maximize their earnings.
Refer to the diagram and list of assumptions. If discrimination is ended:
AACSB: Analytic
Blooms: Analyze
Difficulty: 3 Hard
Learning Objective: 21-07 Discuss labor market discrimination and how it might affect hiring decisions and wages.
Topic: Economic analysis of discrimination
Type: Graph
128.
Assumptions: (1) the labor force is comprised of 9 million men and 9 million women
workers; (2) the economy has 3 occupations, X, Y, and Z, each having identical demand
curves for labor; (3) men and women workers are homogeneous with respect to their
labor-market capabilities; (4) women are discriminated against by being excluded from
occupations X and Y and are confined to Z; and (5) aside from discrimination, the
economy is competitive, and workers seek to maximize their earnings.
Refer to the diagram and list of assumptions. If discrimination is ended, women:
AACSB: Analytic
Blooms: Analyze
Difficulty: 3 Hard
Learning Objective: 21-07 Discuss labor market discrimination and how it might affect hiring decisions and wages.
Topic: Economic analysis of discrimination
Type: Graph
129.
Assumptions: (1) the labor force is comprised of 9 million men and 9 million women
workers; (2) the economy has 3 occupations, X, Y, and Z, each having identical demand
curves for labor; (3) men and women workers are homogeneous with respect to their
labor-market capabilities; (4) women are discriminated against by being excluded from
occupations X and Y and are confined to Z; and (5) aside from discrimination, the
economy is competitive, and workers seek to maximize their earnings.
Refer to the diagram and list of assumptions. The elimination of gender discrimination:
AACSB: Reflective Thinking
Blooms: Analyze
Difficulty: 3 Hard
Learning Objective: 21-07 Discuss labor market discrimination and how it might affect hiring decisions and wages.
Topic: Economic analysis of discrimination
Type: Graph

130.
As applied to gender discrimination, the crowding model of occupational segregation:
AACSB: Reflective Thinking
Accessibility: Keyboard Navigation
Blooms: Understand
Difficulty: 2 Medium
Learning Objective: 21-07 Discuss labor market discrimination and how it might affect hiring decisions and wages.
Topic: Economic analysis of discrimination
131.
Discrimination creates a:
AACSB: Reflective Thinking
Accessibility: Keyboard Navigation
Blooms: Understand
Difficulty: 2 Medium
Learning Objective: 21-07 Discuss labor market discrimination and how it might affect hiring decisions and wages.
Topic: Economic analysis of discrimination
132.
Discrimination:
AACSB: Reflective Thinking
Accessibility: Keyboard Navigation
Blooms: Understand
Difficulty: 2 Medium
Learning Objective: 21-07 Discuss labor market discrimination and how it might affect hiring decisions and wages.
Topic: Economic analysis of discrimination
133.
Economic discrimination puts the economy
inside
its production possibilities curve
because discrimination:
AACSB: Reflective Thinking
Accessibility: Keyboard Navigation
Blooms: Understand
Difficulty: 2 Medium
Learning Objective: 21-07 Discuss labor market discrimination and how it might affect hiring decisions and wages.
Topic: Economic analysis of discrimination
134.
In the diagram, economic discrimination is best represented by point:
AACSB: Analytic
Blooms: Analyze
Difficulty: 3 Hard
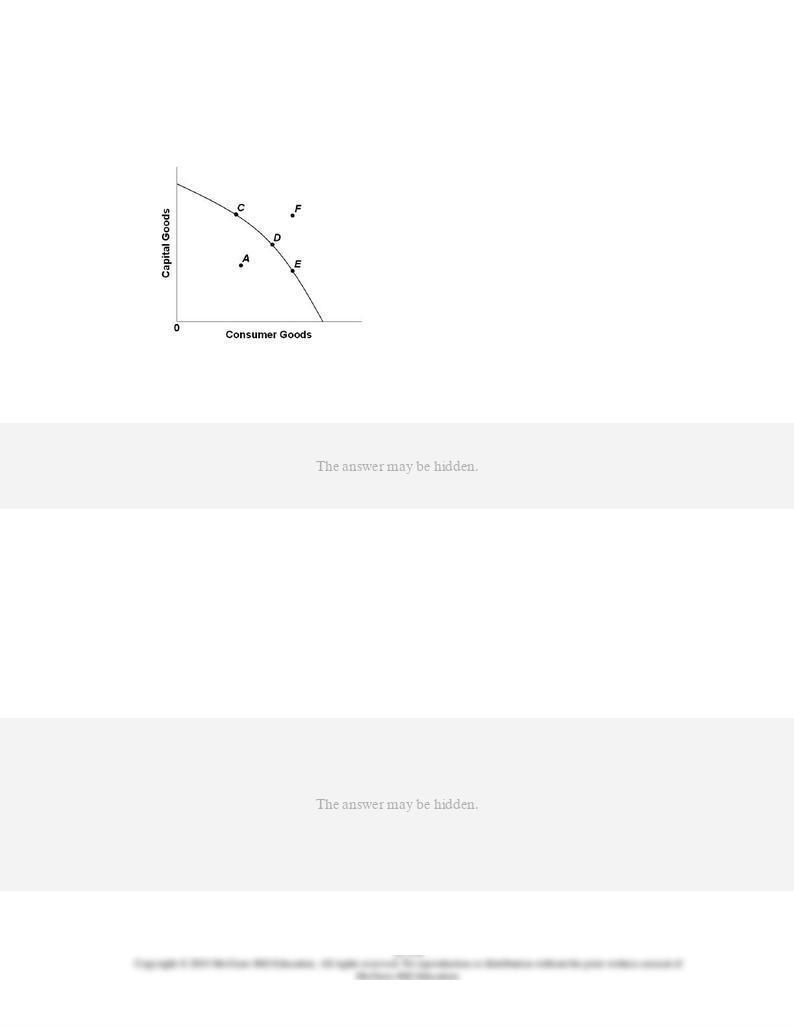
Learning Objective: 21-07 Discuss labor market discrimination and how it might affect hiring decisions and wages.
Topic: Economic analysis of discrimination
Type: Graph
135.
In the diagram, the elimination of discrimination is best represented by:
AACSB: Analytic
Blooms: Analyze
Difficulty: 3 Hard
Learning Objective: 21-07 Discuss labor market discrimination and how it might affect hiring decisions and wages.
Topic: Economic analysis of discrimination
Type: Graph
136.
(Consider This) According to economists Krueger and Perri:
AACSB: Reflective Thinking

Accessibility: Keyboard Navigation
Blooms: Remember
Difficulty: 1 Easy
Learning Objective: 21-03 Demonstrate how income inequality has changed since 1975.
Topic: Income inequality over time
137.
(Consider This) According to
The
Economist
magazine, growing income inequality is less
of a concern because:
AACSB: Reflective Thinking
Accessibility: Keyboard Navigation
Blooms: Remember
Difficulty: 1 Easy
Learning Objective: 21-03 Demonstrate how income inequality has changed since 1975.
Topic: Income inequality over time
138.
(Consider This) In "Slicing the Pizza," the shrinkage of the pizza refers to the:
AACSB: Reflective Thinking
Accessibility: Keyboard Navigation
Blooms: Understand
Difficulty: 2 Medium
Learning Objective: 21-04 Debate the economic arguments for and against income inequality.
Topic: Equality versus efficiency

139.
(Consider This) The main focus of the vignette "Slicing the Pizza" is the:
AACSB: Reflective Thinking
Accessibility: Keyboard Navigation
Blooms: Understand
Difficulty: 2 Medium
Learning Objective: 21-04 Debate the economic arguments for and against income inequality.
Topic: Equality versus efficiency
140.
(Last Word) Between 1995 and 2007 in the United States:
AACSB: Reflective Thinking
Accessibility: Keyboard Navigation
Blooms: Remember
Difficulty: 1 Easy
Learning Objective: 21-02 Discuss the extent and sources of income inequality.
Topic: Causes of income inequality
141.
(Last Word) In 2010, the wealthiest 1 percent of U.S. households held about ____ percent
B.
77.
C.
23.
D.
32.
AACSB: Reflective Thinking
Accessibility: Keyboard Navigation
Blooms: Remember

Difficulty: 1 Easy
Learning Objective: 21-02 Discuss the extent and sources of income inequality.
Topic: Causes of income inequality
142.
(Last Word) Median wealth in the United States in 2010:
AACSB: Reflective Thinking
Accessibility: Keyboard Navigation
Blooms: Remember
Difficulty: 1 Easy
Learning Objective: 21-02 Discuss the extent and sources of income inequality.
Topic: Causes of income inequality
True / False Questions
143.
Government transfer programs result in a U.S. Lorenz curve that is closer to the diagonal
line than would be the case without the programs.
AACSB: Reflective Thinking
Accessibility: Keyboard Navigation
Blooms: Understand
Difficulty: 2 Medium
Learning Objective: 21-01 Explain how income inequality in the United States is measured and described.
Learning Objective: 21-02 Discuss the extent and sources of income inequality.
Topic: Causes of income inequality
Topic: Facts about income inequality

144.
The closer the Lorenz curve is to the diagonal, the greater is the degree of income
inequality.
AACSB: Reflective Thinking
Accessibility: Keyboard Navigation
Blooms: Understand
Difficulty: 2 Medium
Learning Objective: 21-01 Explain how income inequality in the United States is measured and described.
Topic: Facts about income inequality
145.
The standard data on income distribution do not include the value of noncash transfers as
income.
AACSB: Analytic
Accessibility: Keyboard Navigation
Blooms: Remember
Difficulty: 1 Easy
Learning Objective: 21-01 Explain how income inequality in the United States is measured and described.
Topic: Facts about income inequality
146.
A curve showing the quintile distribution of a nation's income is called the Gini curve.
AACSB: Analytic
Accessibility: Keyboard Navigation
Blooms: Remember
Difficulty: 1 Easy
Learning Objective: 21-01 Explain how income inequality in the United States is measured and described.
Topic: Facts about income inequality
147.
In the United States since 1975, the poor have gotten poorer and the rich have gotten
richer in both relative and absolute terms.
AACSB: Reflective Thinking
Accessibility: Keyboard Navigation
Blooms: Remember

Difficulty: 1 Easy
Learning Objective: 21-03 Demonstrate how income inequality has changed since 1975.
Topic: Income inequality over time
148.
The top 20 percent of U.S. income earners receive nearly 80 percent of total U.S. income.
AACSB: Reflective Thinking
Accessibility: Keyboard Navigation
Blooms: Remember
Difficulty: 1 Easy
Learning Objective: 21-01 Explain how income inequality in the United States is measured and described.
Learning Objective: 21-02 Discuss the extent and sources of income inequality.
Topic: Causes of income inequality
Topic: Facts about income inequality
149.
Currently over 90 percent of all workers in the United States are covered by Social
Security.
AACSB: Reflective Thinking
Accessibility: Keyboard Navigation
Blooms: Remember
Difficulty: 1 Easy
Learning Objective: 21-06 Identify the major components of the income-maintenance program in the United States.
Topic: U.S. income-maintenance system
150.
Unemployment compensation is financed by taxes levied on employers.
AACSB: Analytic
Accessibility: Keyboard Navigation
Blooms: Remember
Difficulty: 1 Easy
Learning Objective: 21-06 Identify the major components of the income-maintenance program in the United States.
Topic: U.S. income-maintenance system

151.
TANF stands for Temporary Assistance for Needy Families.
AACSB: Analytic
Accessibility: Keyboard Navigation
Blooms: Remember
Difficulty: 1 Easy
Learning Objective: 21-06 Identify the major components of the income-maintenance program in the United States.
Topic: U.S. income-maintenance system
152.
After the implementation of TANF, the U.S. welfare rolls fell by more than one-half
between 1996 and 2007.
AACSB: Reflective Thinking
Accessibility: Keyboard Navigation
Blooms: Remember
Difficulty: 1 Easy
Learning Objective: 21-06 Identify the major components of the income-maintenance program in the United States.
Topic: U.S. income-maintenance system
153.
The U.S. poverty rate for the elderly (65 and over) is higher than for the general
population.
AACSB: Reflective Thinking
Accessibility: Keyboard Navigation
Blooms: Remember
Difficulty: 1 Easy
Learning Objective: 21-05 Relate how poverty is measured and its incidence by age; gender; ethnicity; and other
characteristics.
Topic: Economics of poverty
154.
The U.S. poverty rate was considerably lower in 2011 than in 1960.
AACSB: Reflective Thinking
Accessibility: Keyboard Navigation
Blooms: Remember
Difficulty: 1 Easy

Learning Objective: 21-05 Relate how poverty is measured and its incidence by age; gender; ethnicity; and other
characteristics.
Topic: Economics of poverty
155.
Labor market discrimination increases the size of the nation's GDP by promoting
specialization on the basis of race.
AACSB: Reflective Thinking
Accessibility: Keyboard Navigation
Blooms: Understand
Difficulty: 2 Medium
Learning Objective: 21-07 Discuss labor market discrimination and how it might affect hiring decisions and wages.
Topic: Economic analysis of discrimination
156.
An employer (biased against African Americans) whose discrimination coefficient is $5 will
hire only whites if the actual African-American-white wage gap is $7.
AACSB: Analytic
Accessibility: Keyboard Navigation
Blooms: Analyze
Difficulty: 3 Hard
Learning Objective: 21-07 Discuss labor market discrimination and how it might affect hiring decisions and wages.
Topic: Economic analysis of discrimination
157.
A reduction in the collective discrimination coefficients of employers will increase the
wage rate of those discriminated against but reduce their employment.
AACSB: Reflective Thinking
Accessibility: Keyboard Navigation
Blooms: Analyze
Difficulty: 3 Hard
Learning Objective: 21-07 Discuss labor market discrimination and how it might affect hiring decisions and wages.
Topic: Economic analysis of discrimination

158.
Statistical discrimination is also known as occupational discrimination.
AACSB: Analytic
Accessibility: Keyboard Navigation
Blooms: Remember
Difficulty: 1 Easy
Learning Objective: 21-07 Discuss labor market discrimination and how it might affect hiring decisions and wages.
Topic: Economic analysis of discrimination
159.
The crowding model of occupational segregation predicts that domestic output will
increase if occupational segregation is ended.
AACSB: Reflective Thinking
Accessibility: Keyboard Navigation
Blooms: Understand
Difficulty: 2 Medium
Learning Objective: 21-07 Discuss labor market discrimination and how it might affect hiring decisions and wages.
Topic: Economic analysis of discrimination