
Chapter 28 Basic Macroeconomic Relationships Answer Key
Multiple Choice Questions
1.
The most important determinant of consumer spending is:
AACSB: Analytic
Accessibility: Keyboard Navigation
Blooms: Understand
Difficulty: 2 Medium
Learning Objective: 28-01 Describe how changes in income affect consumption (and saving).
Topic: Income-consumption and income-saving relationships
2.
The most important determinant of consumption and saving is the:
AACSB: Analytic
Accessibility: Keyboard Navigation
Blooms: Understand
Difficulty: 2 Medium
Learning Objective: 28-01 Describe how changes in income affect consumption (and saving).
Topic: Income-consumption and income-saving relationships

3.
If Carol's disposable income increases from $1,200 to $1,700 and her level of saving
increases from minus $100 to a plus $100, her marginal propensity to:
AACSB: Analytic
Accessibility: Keyboard Navigation
Blooms: Apply
Difficulty: 2 Medium
Learning Objective: 28-01 Describe how changes in income affect consumption (and saving).
Topic: Income-consumption and income-saving relationships
4.
With a marginal propensity to save of .4, the marginal propensity to consume will be:
AACSB: Analytic
Accessibility: Keyboard Navigation
Blooms: Understand
Difficulty: 2 Medium
Learning Objective: 28-01 Describe how changes in income affect consumption (and saving).
Topic: Income-consumption and income-saving relationships
5.
The MPC can be defined as that fraction of a:
AACSB: Analytic
Accessibility: Keyboard Navigation
Blooms: Remember

Difficulty: 1 Easy
Learning Objective: 28-01 Describe how changes in income affect consumption (and saving).
Topic: Income-consumption and income-saving relationships
6.
The 45-degree line on a graph relating consumption and income shows:
AACSB: Analytic
Accessibility: Keyboard Navigation
Blooms: Remember
Difficulty: 1 Easy
Learning Objective: 28-01 Describe how changes in income affect consumption (and saving).
Topic: Income-consumption and income-saving relationships
7.
As disposable income goes up, the:
AACSB: Reflective Thinking
Accessibility: Keyboard Navigation
Blooms: Understand
Difficulty: 2 Medium
Learning Objective: 28-01 Describe how changes in income affect consumption (and saving).
Topic: Income-consumption and income-saving relationships

8.
The consumption schedule shows:
AACSB: Analytic
Accessibility: Keyboard Navigation
Blooms: Remember
Difficulty: 1 Easy
Learning Objective: 28-01 Describe how changes in income affect consumption (and saving).
Topic: Income-consumption and income-saving relationships
9.
The consumption schedule directly relates:
AACSB: Analytic
Accessibility: Keyboard Navigation
Blooms: Remember
Difficulty: 1 Easy
Learning Objective: 28-01 Describe how changes in income affect consumption (and saving).
Topic: Income-consumption and income-saving relationships
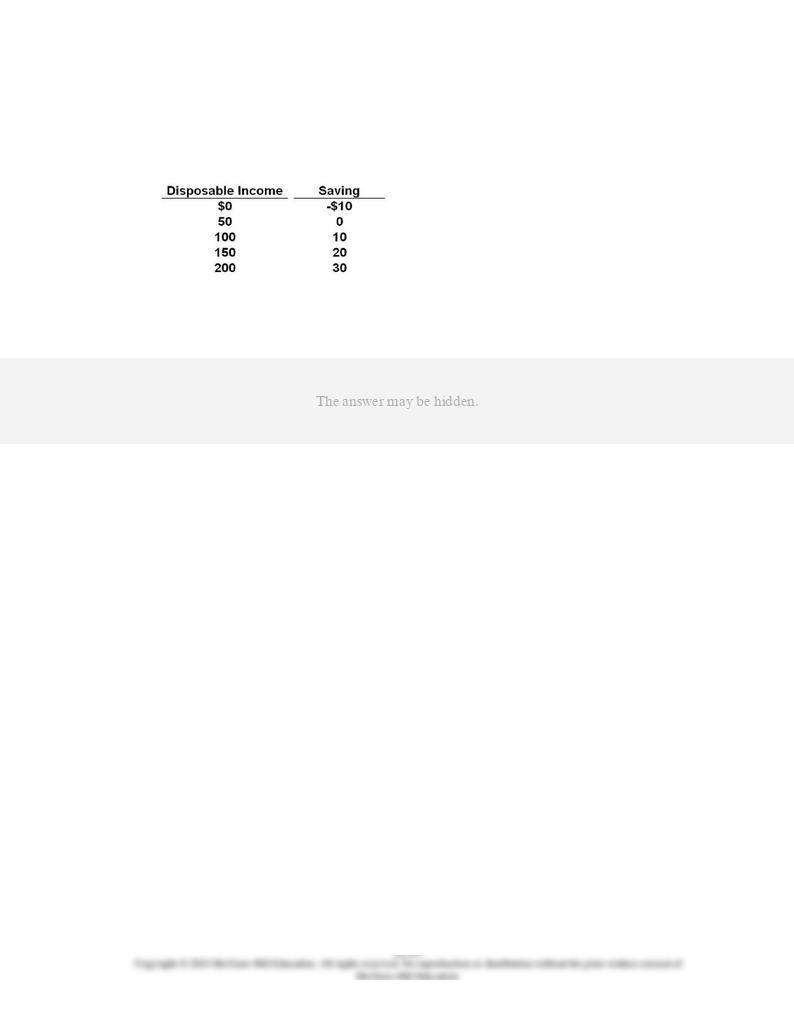
10.
A decline in disposable income:
AACSB: Reflective Thinking
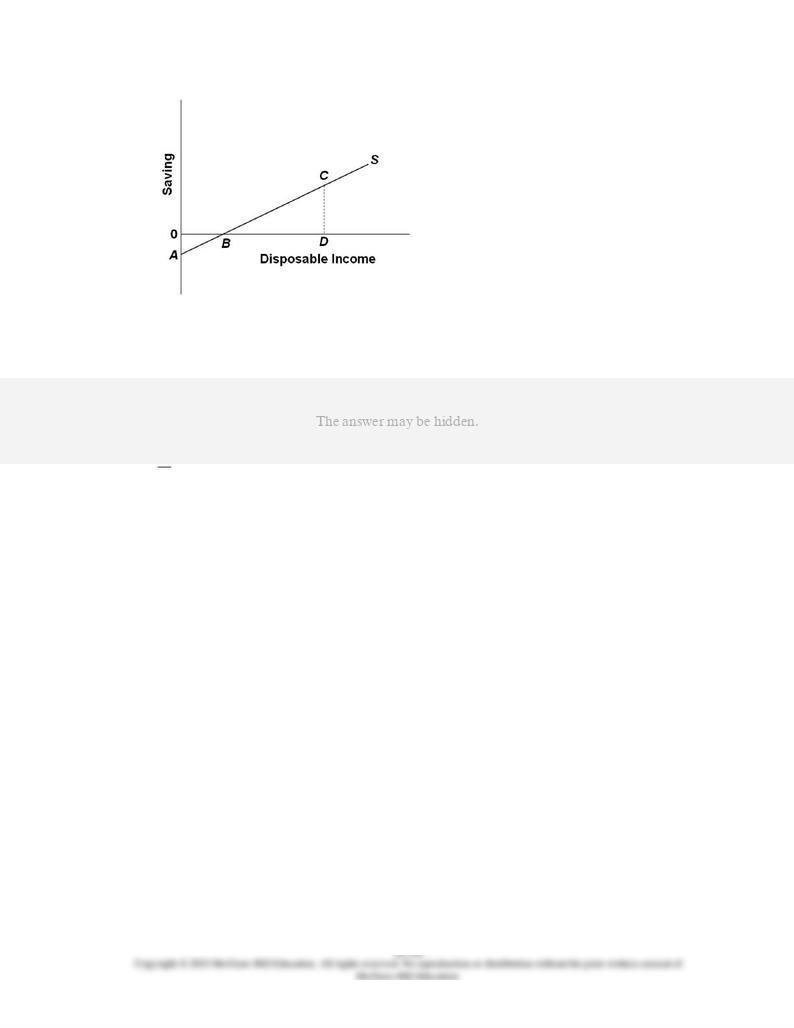
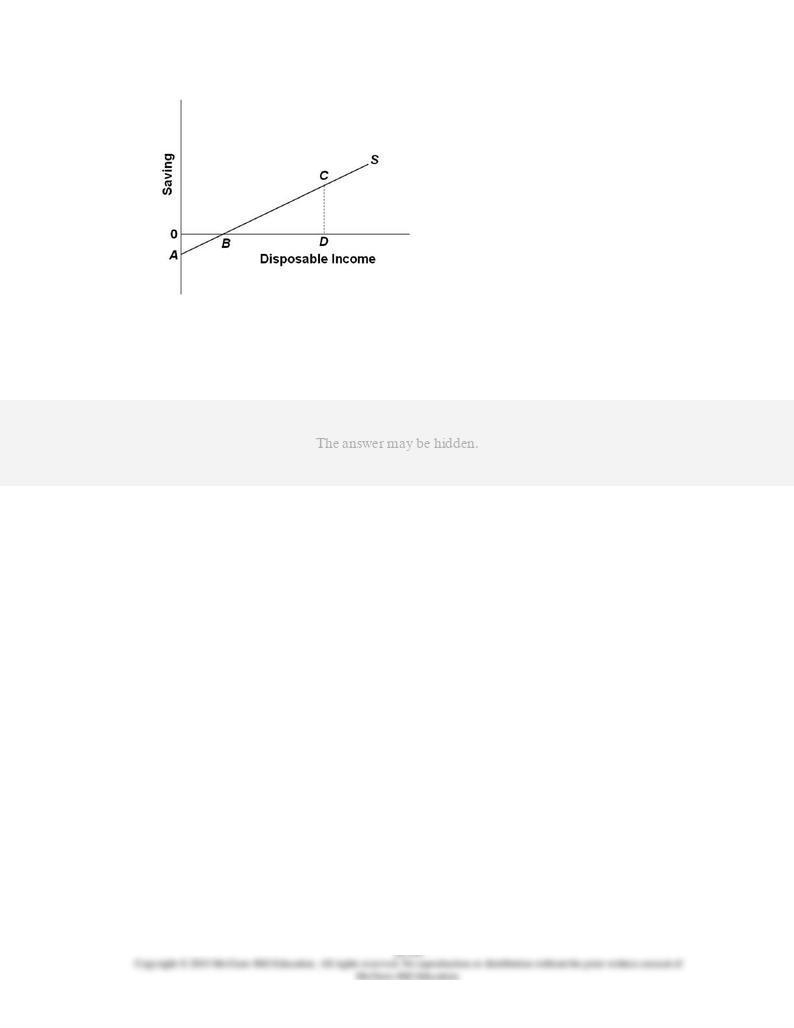
Accessibility: Keyboard Navigation
Blooms: Understand

Difficulty: 2 Medium
Learning Objective: 28-01 Describe how changes in income affect consumption (and saving).
Topic: Income-consumption and income-saving relationships
11.
The APC is calculated as:
AACSB: Analytic
Accessibility: Keyboard Navigation
Blooms: Remember
Difficulty: 1 Easy
Learning Objective: 28-01 Describe how changes in income affect consumption (and saving).
Topic: Income-consumption and income-saving relationships
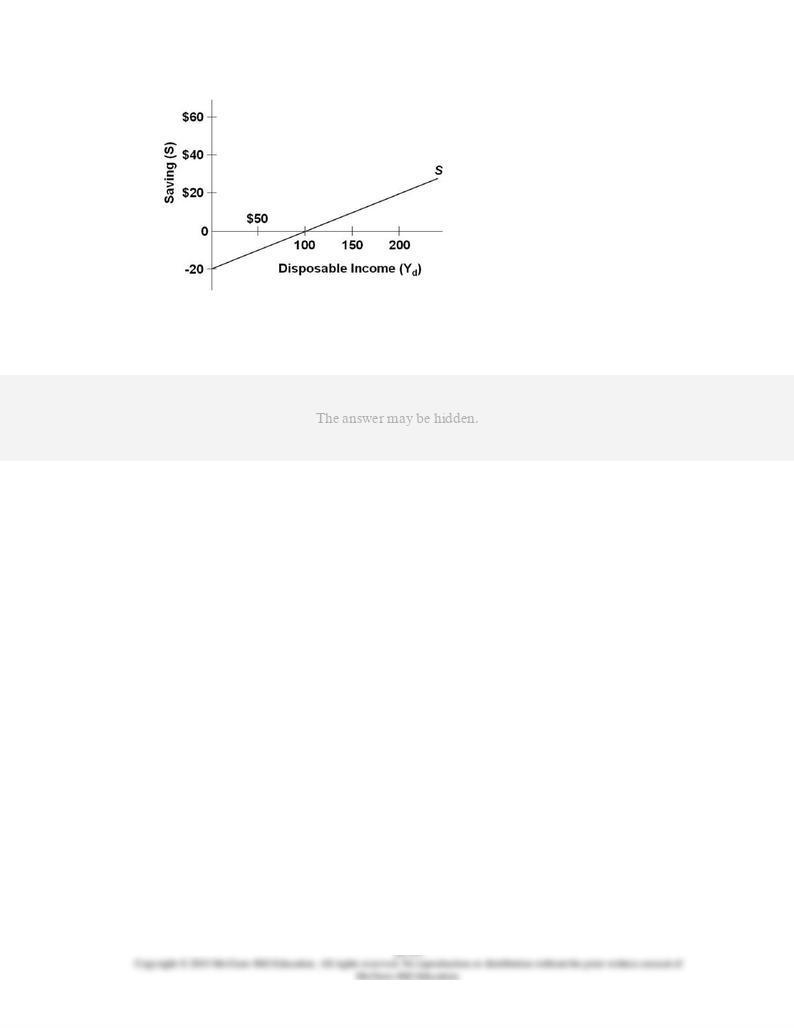
12.
The consumption schedule shows:
AACSB: Reflective Thinking
Accessibility: Keyboard Navigation
Blooms: Understand
Difficulty: 2 Medium
Learning Objective: 28-01 Describe how changes in income affect consumption (and saving).
Topic: Income-consumption and income-saving relationships
13.
The APC can be defined as the fraction of a:
AACSB: Analytic
Accessibility: Keyboard Navigation
Blooms: Remember
Difficulty: 1 Easy
Learning Objective: 28-01 Describe how changes in income affect consumption (and saving).
Topic: Income-consumption and income-saving relationships
14.
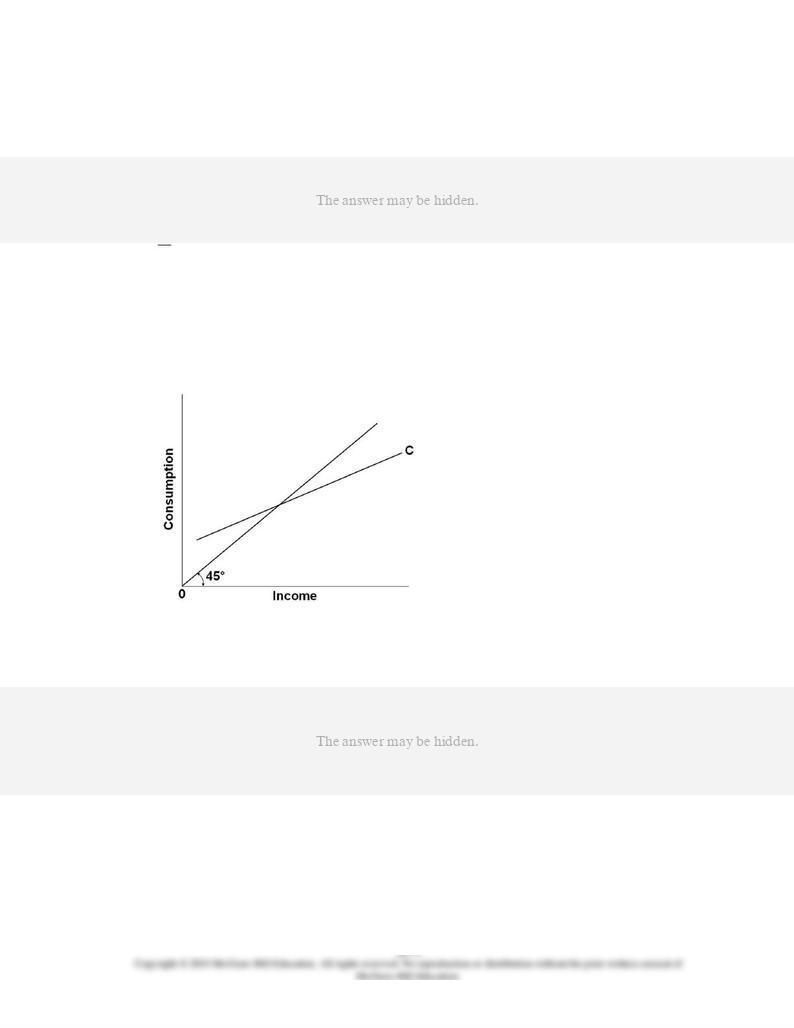
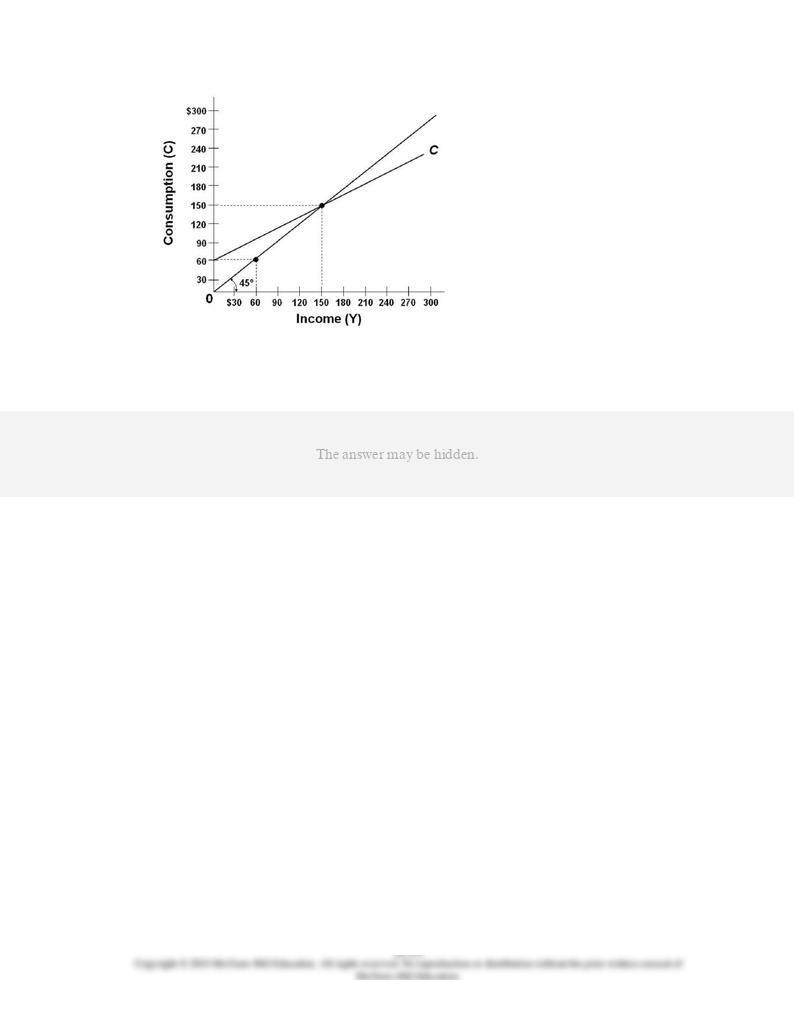
Refer to the figure. The consumption schedule indicates that:
AACSB: Reflective Thinking
Blooms: Understand
Difficulty: 2 Medium
Learning Objective: 28-01 Describe how changes in income affect consumption (and saving).
Topic: Income-consumption and income-saving relationships
Type: Graph

15.
The consumption schedule is drawn on the assumption that as income increases,
consumption will:
AACSB: Reflective Thinking
Accessibility: Keyboard Navigation
Blooms: Remember
Difficulty: 1 Easy
Learning Objective: 28-01 Describe how changes in income affect consumption (and saving).
Topic: Income-consumption and income-saving relationships
16.
Which of the following is
correct
?
AACSB: Analytic
Accessibility: Keyboard Navigation
Blooms: Remember
Difficulty: 1 Easy
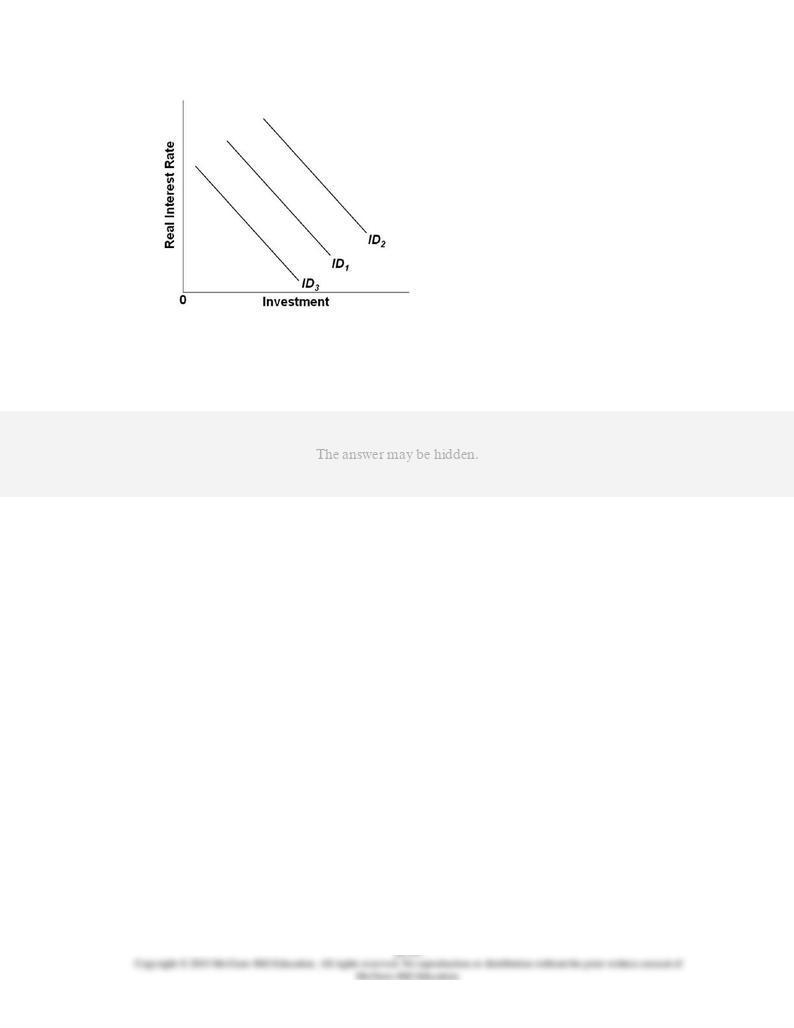
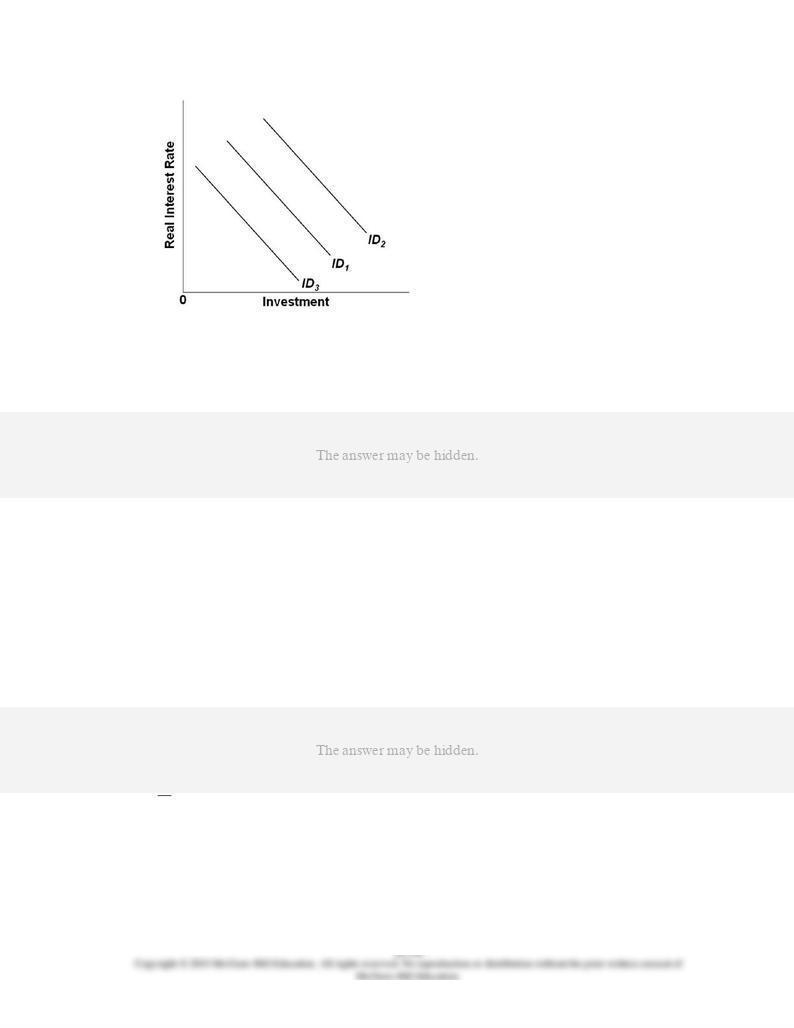
Learning Objective: 28-01 Describe how changes in income affect consumption (and saving).
Topic: Income-consumption and income-saving relationships
17.
The consumption schedule is such that:
AACSB: Reflective Thinking
Accessibility: Keyboard Navigation

Blooms: Understand
Difficulty: 2 Medium
Learning Objective: 28-01 Describe how changes in income affect consumption (and saving).
Topic: Income-consumption and income-saving relationships
18.
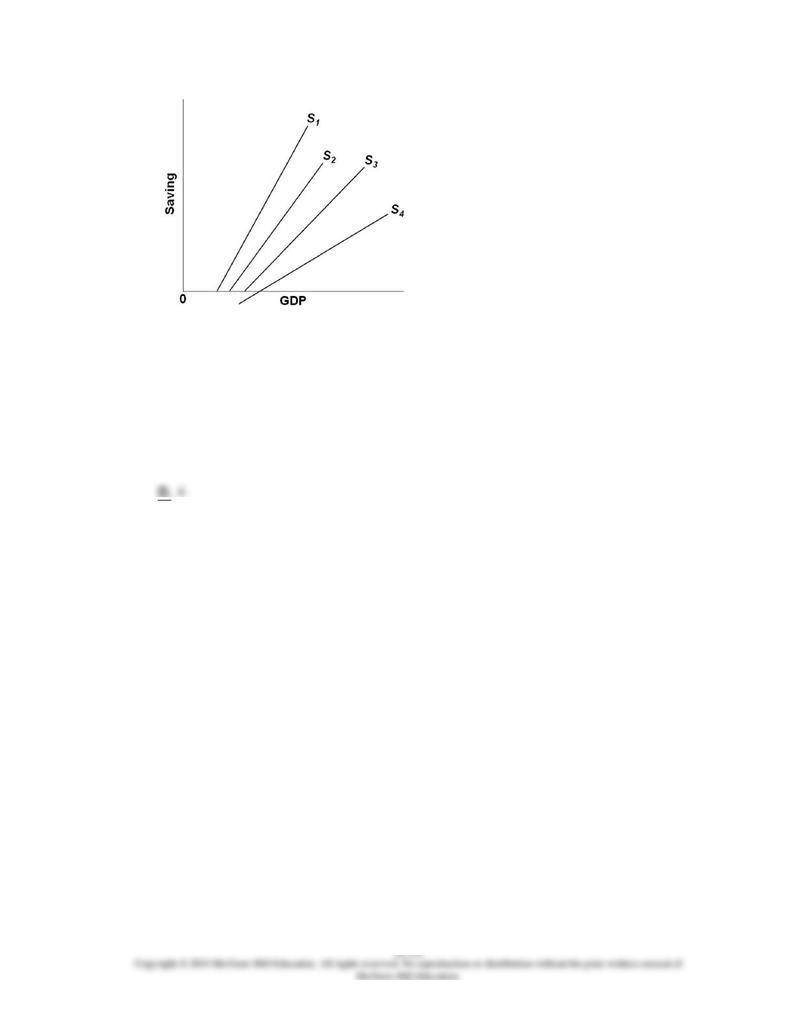
The consumption and saving schedules reveal that the:
AACSB: Reflective Thinking
Accessibility: Keyboard Navigation
Blooms: Understand
Difficulty: 2 Medium
Learning Objective: 28-01 Describe how changes in income affect consumption (and saving).
Topic: Income-consumption and income-saving relationships
19.
The size of the MPC is assumed to be:
AACSB: Reflective Thinking
Accessibility: Keyboard Navigation
Blooms: Remember
Difficulty: 1 Easy
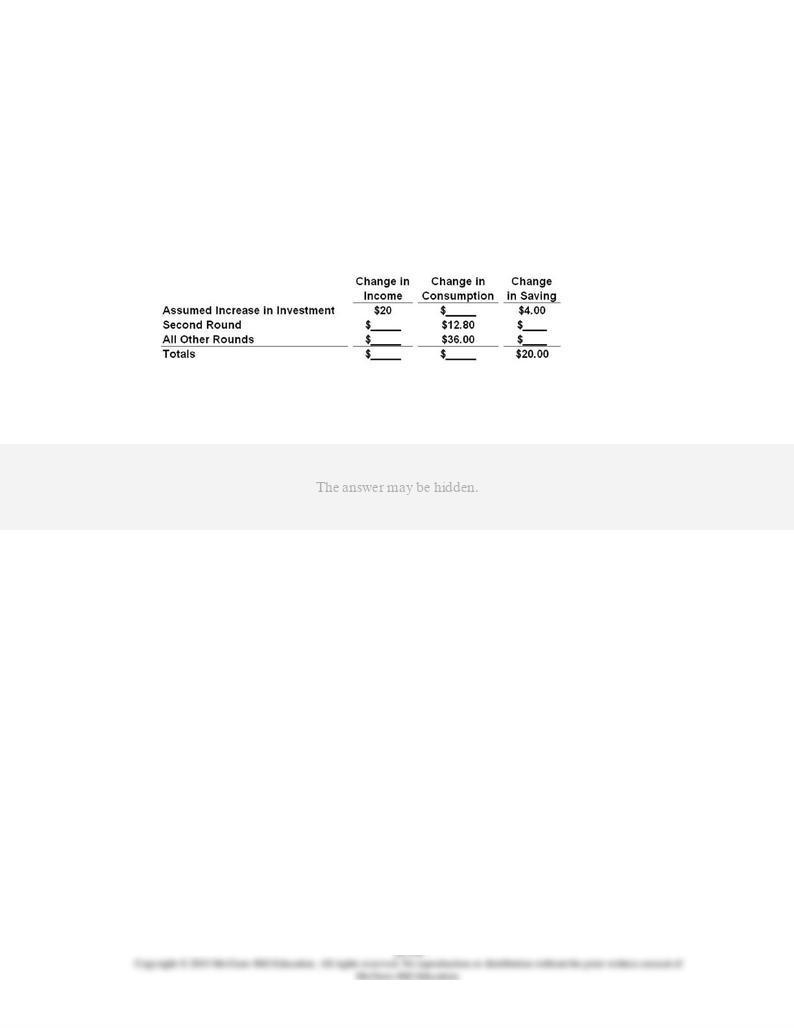
Learning Objective: 28-01 Describe how changes in income affect consumption (and saving).
Topic: Income-consumption and income-saving relationships

20.
As disposable income increases, consumption:
AACSB: Reflective Thinking
Accessibility: Keyboard Navigation
Blooms: Understand
Difficulty: 2 Medium
Learning Objective: 28-01 Describe how changes in income affect consumption (and saving).
Topic: Income-consumption and income-saving relationships
21.
The relationship between consumption and disposable income is such that:
AACSB: Reflective Thinking
Accessibility: Keyboard Navigation
Blooms: Understand
Difficulty: 2 Medium
Learning Objective: 28-01 Describe how changes in income affect consumption (and saving).
Topic: Income-consumption and income-saving relationships
22.
If the MPC is .8 and disposable income is $200, then:
AACSB: Analytic
Accessibility: Keyboard Navigation
Blooms: Apply
Difficulty: 2 Medium

Learning Objective: 28-01 Describe how changes in income affect consumption (and saving).
Topic: Income-consumption and income-saving relationships
23.
The MPC for an economy is:
AACSB: Analytic
Accessibility: Keyboard Navigation
Blooms: Remember
Difficulty: 1 Easy
Learning Objective: 28-01 Describe how changes in income affect consumption (and saving).
Topic: Income-consumption and income-saving relationships
24.
In contrast to investment, consumption is:
AACSB: Reflective Thinking
Accessibility: Keyboard Navigation
Blooms: Understand
Difficulty: 2 Medium
Learning Objective: 28-01 Describe how changes in income affect consumption (and saving).
Topic: Income-consumption and income-saving relationships

25.
(Advanced analysis) Answer the question on the basis of the following consumption
schedule:
C
= 20 + .9
Y
, where
C
is consumption and
Y
is disposable income.
Refer to the given data. The MPC is:
AACSB: Analytic
Accessibility: Keyboard Navigation
Blooms: Apply
Difficulty: 2 Medium
Learning Objective: 28-01 Describe how changes in income affect consumption (and saving).
Topic: Income-consumption and income-saving relationships
26.
(Advanced analysis) Answer the question on the basis of the following consumption
schedule:
C
= 20 + .9
Y
, where
C
is consumption and
Y
is disposable income.
Refer to the given data. At an $800 level of disposable income, the level of saving is:
AACSB: Analytic
Accessibility: Keyboard Navigation
Blooms: Apply
Difficulty: 2 Medium
Learning Objective: 28-01 Describe how changes in income affect consumption (and saving).
Topic: Income-consumption and income-saving relationships
27.
Which one of the following will cause a movement down along an economy's consumption
schedule?
AACSB: Reflective Thinking
Accessibility: Keyboard Navigation
Blooms: Understand
Difficulty: 2 Medium
Learning Objective: 28-01 Describe how changes in income affect consumption (and saving).
Topic: Income-consumption and income-saving relationships
28.
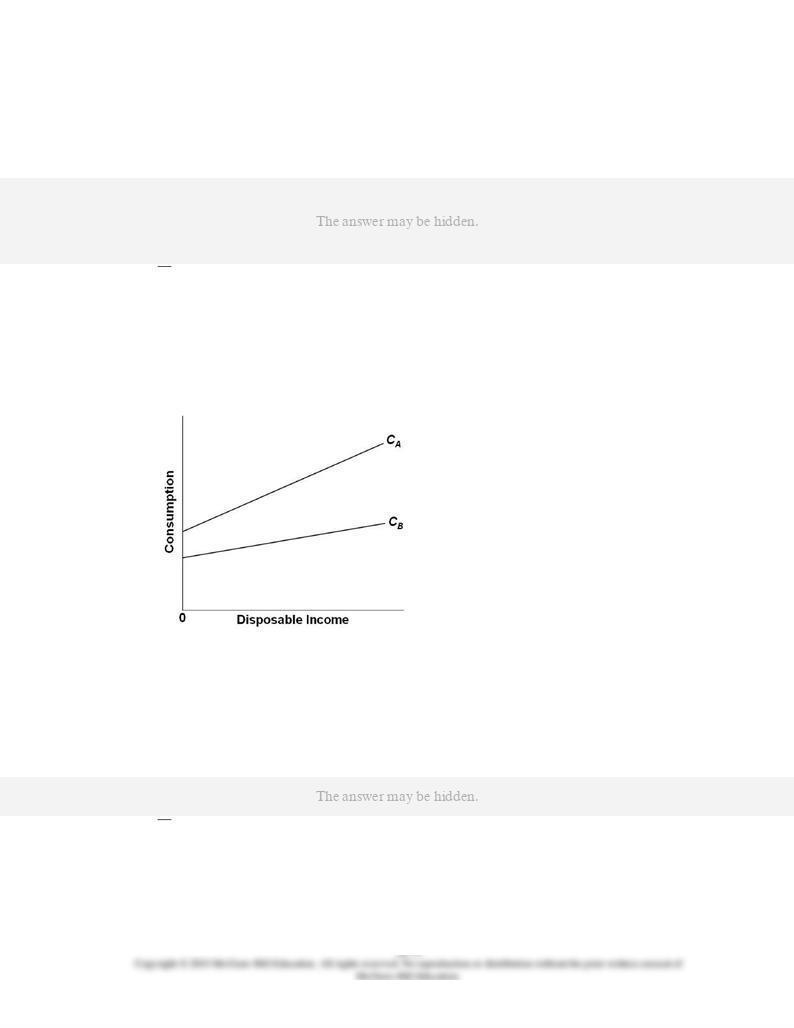
Refer to the given diagram, which shows consumption schedules for economies A and B.
We can say that the:
A.
MPC is greater in B than in A.
B.
APC at any given income level is greater in B than in A.
AACSB: Reflective Thinking
Blooms: Understand
Difficulty: 2 Medium
Learning Objective: 28-01 Describe how changes in income affect consumption (and saving).
Topic: Income-consumption and income-saving relationships

Type: Graph
29.
At the point where the consumption schedule intersects the 45-degree line:
AACSB: Reflective Thinking
Accessibility: Keyboard Navigation
Blooms: Understand
Difficulty: 2 Medium
Learning Objective: 28-01 Describe how changes in income affect consumption (and saving).
Topic: Income-consumption and income-saving relationships
30.
Tessa's break-even income is $10,000 and her MPC is 0.75. If her actual disposable
income is $16,000, her level of:
AACSB: Analytic
Accessibility: Keyboard Navigation
Blooms: Apply
Difficulty: 2 Medium
Learning Objective: 28-01 Describe how changes in income affect consumption (and saving).
Topic: Income-consumption and income-saving relationships
31.
If Trent's MPC is .80, this means that he will:
AACSB: Reflective Thinking

Accessibility: Keyboard Navigation
Blooms: Understand
Difficulty: 2 Medium
Learning Objective: 28-01 Describe how changes in income affect consumption (and saving).
Topic: Income-consumption and income-saving relationships
32.
Suppose a family's consumption exceeds its disposable income. This means that its:
AACSB: Analytic
Accessibility: Keyboard Navigation
Blooms: Understand
Difficulty: 2 Medium
Learning Objective: 28-01 Describe how changes in income affect consumption (and saving).
Topic: Income-consumption and income-saving relationships
33.
(Advanced analysis) If the equation for the consumption schedule is
C
= 20 + .8
Y
, where
C
is consumption and
Y
is disposable income, then the average propensity to consume is 1
when disposable income is:
AACSB: Analytic
Accessibility: Keyboard Navigation
Blooms: Apply
Difficulty: 2 Medium
Learning Objective: 28-01 Describe how changes in income affect consumption (and saving).
Topic: Income-consumption and income-saving relationships

34.
(Advanced analysis) The equation
C
= 35 + .75
Y
, where
C
is consumption and
Y
is
disposable income, shows that:
AACSB: Analytic
Accessibility: Keyboard Navigation
Blooms: Understand
Difficulty: 2 Medium
Learning Objective: 28-01 Describe how changes in income affect consumption (and saving).
Topic: Income-consumption and income-saving relationships
35.
(Advanced analysis) If the equation
C
= 20 + .6
Y
, where
C
is consumption and
Y
is
disposable income, were graphed:
AACSB: Analytic
Accessibility: Keyboard Navigation
Blooms: Understand
Difficulty: 2 Medium
Learning Objective: 28-01 Describe how changes in income affect consumption (and saving).
Topic: Income-consumption and income-saving relationships

36.
One can determine the amount of any level of total income that is consumed by:
AACSB: Analytic
Accessibility: Keyboard Navigation
Blooms: Understand
Difficulty: 2 Medium
Learning Objective: 28-01 Describe how changes in income affect consumption (and saving).
Topic: Income-consumption and income-saving relationships
37.
Which of the following is
correct
?
AACSB: Analytic
Accessibility: Keyboard Navigation
Blooms: Understand
Difficulty: 2 Medium
Learning Objective: 28-01 Describe how changes in income affect consumption (and saving).
Topic: Income-consumption and income-saving relationships
38.
Dissaving means:
AACSB: Analytic
Accessibility: Keyboard Navigation
Blooms: Remember
Difficulty: 1 Easy

Learning Objective: 28-01 Describe how changes in income affect consumption (and saving).
Topic: Income-consumption and income-saving relationships
39.
Dissaving occurs where:
AACSB: Analytic
Accessibility: Keyboard Navigation
Blooms: Remember
Difficulty: 1 Easy
Learning Objective: 28-01 Describe how changes in income affect consumption (and saving).
Topic: Income-consumption and income-saving relationships
40.
Which of the following relations is
not
correct?
AACSB: Analytic
Accessibility: Keyboard Navigation
Blooms: Remember
Difficulty: 1 Easy
Learning Objective: 28-01 Describe how changes in income affect consumption (and saving).
Topic: Income-consumption and income-saving relationships
41.
The saving schedule is drawn on the assumption that as income increases:
AACSB: Reflective Thinking

Accessibility: Keyboard Navigation
Blooms: Understand
Difficulty: 2 Medium
Learning Objective: 28-01 Describe how changes in income affect consumption (and saving).
Topic: Income-consumption and income-saving relationships
42.
At the point where the consumption schedule intersects the 45-degree line:
AACSB: Reflective Thinking
Accessibility: Keyboard Navigation
Blooms: Understand
Difficulty: 2 Medium
Learning Objective: 28-01 Describe how changes in income affect consumption (and saving).
Topic: Income-consumption and income-saving relationships
43.
The saving schedule is such that as aggregate income increases by a certain amount,
saving:
AACSB: Reflective Thinking
Accessibility: Keyboard Navigation
Blooms: Understand
Difficulty: 2 Medium
Learning Objective: 28-01 Describe how changes in income affect consumption (and saving).
Topic: Income-consumption and income-saving relationships

44.
If the consumption schedule is linear, then the:
AACSB: Reflective Thinking
Accessibility: Keyboard Navigation
Blooms: Understand
Difficulty: 2 Medium
Learning Objective: 28-01 Describe how changes in income affect consumption (and saving).
Topic: Income-consumption and income-saving relationships
45.
Given the consumption schedule, it is possible to graph the relevant saving schedule by:
AACSB: Reflective Thinking
Accessibility: Keyboard Navigation
Blooms: Understand
Difficulty: 2 Medium
Learning Objective: 28-01 Describe how changes in income affect consumption (and saving).
Topic: Income-consumption and income-saving relationships
46.
If the marginal propensity to consume is .9, then the marginal propensity to save must be:
A.
1.
C.
1.1.
AACSB: Analytic

Accessibility: Keyboard Navigation
Blooms: Understand
Difficulty: 2 Medium
Learning Objective: 28-01 Describe how changes in income affect consumption (and saving).
Topic: Income-consumption and income-saving relationships
47.
The greater is the marginal propensity to consume, the:
AACSB: Reflective Thinking
Accessibility: Keyboard Navigation
Blooms: Understand
Difficulty: 2 Medium
Learning Objective: 28-01 Describe how changes in income affect consumption (and saving).
Topic: Income-consumption and income-saving relationships
48.
If the saving schedule is a straight line, the:
AACSB: Reflective Thinking
Accessibility: Keyboard Navigation
Blooms: Understand
Difficulty: 2 Medium
Learning Objective: 28-01 Describe how changes in income affect consumption (and saving).
Topic: Income-consumption and income-saving relationships

49.
Which one of the following will cause a movement up along an economy's saving
schedule?
AACSB: Analytic
Accessibility: Keyboard Navigation
Blooms: Understand
Difficulty: 2 Medium
Learning Objective: 28-01 Describe how changes in income affect consumption (and saving).
Topic: Income-consumption and income-saving relationships
50.
In the late 1990s, the U.S. stock market boomed, causing U.S. consumption to rise.
Economists refer to this outcome as the:
AACSB: Analytic
Accessibility: Keyboard Navigation
Blooms: Remember
Difficulty: 1 Easy
Learning Objective: 28-02 List and explain factors other than income that can affect consumption.
Topic: Nonincome determinants of consumption and saving
51.
The wealth effect is shown graphically as a:
AACSB: Reflective Thinking
Accessibility: Keyboard Navigation
Blooms: Understand
Difficulty: 2 Medium
Learning Objective: 28-02 List and explain factors other than income that can affect consumption.
Topic: Nonincome determinants of consumption and saving
52.
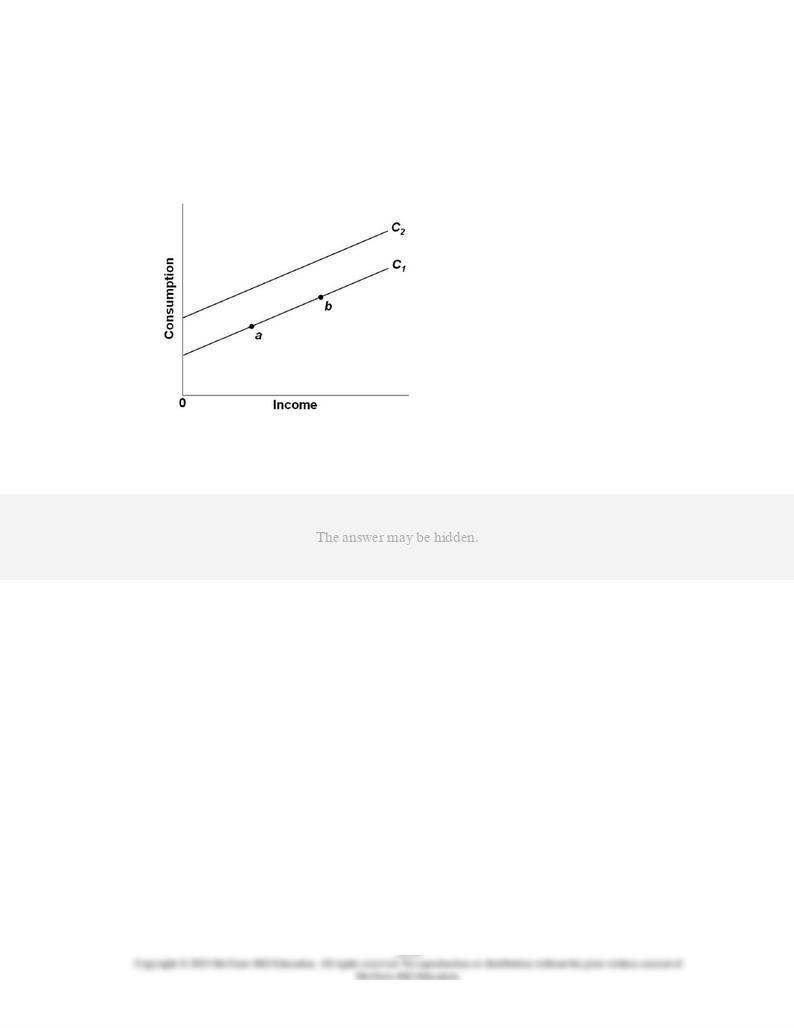
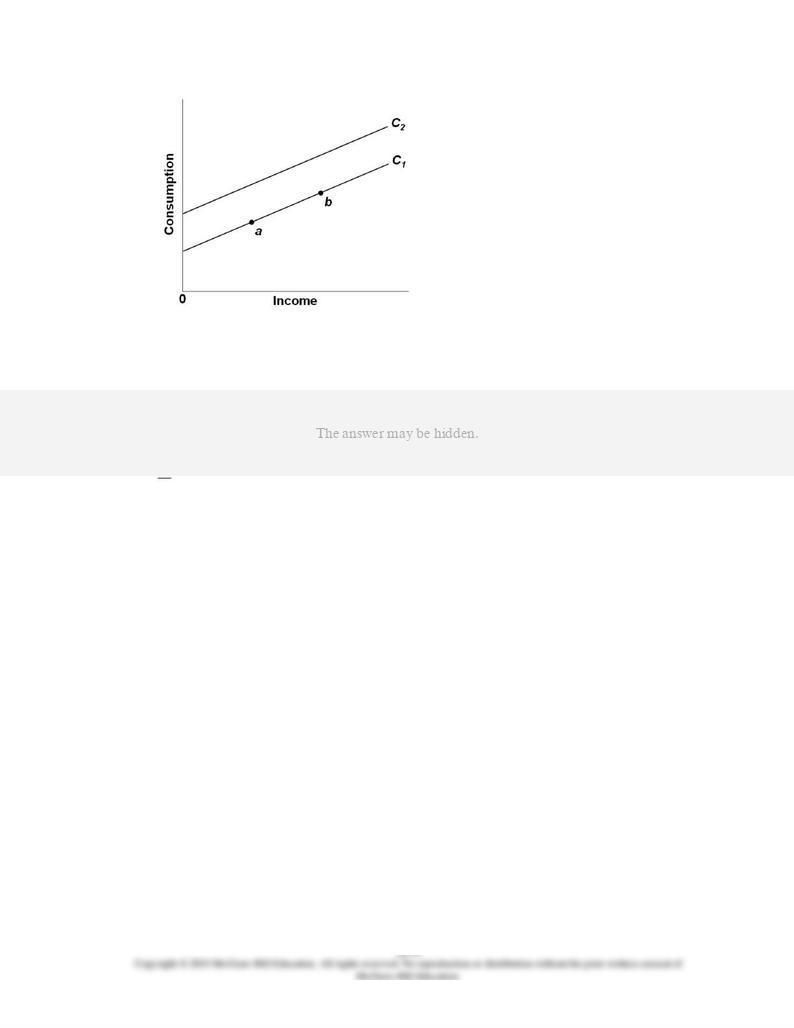
Refer to the given graph. A movement from
b
to
a
along
C
1 might be caused by a(n):
AACSB: Reflective Thinking
Blooms: Analyze
Difficulty: 3 Hard
Learning Objective: 28-02 List and explain factors other than income that can affect consumption.
Topic: Nonincome determinants of consumption and saving
Type: Graph
53.
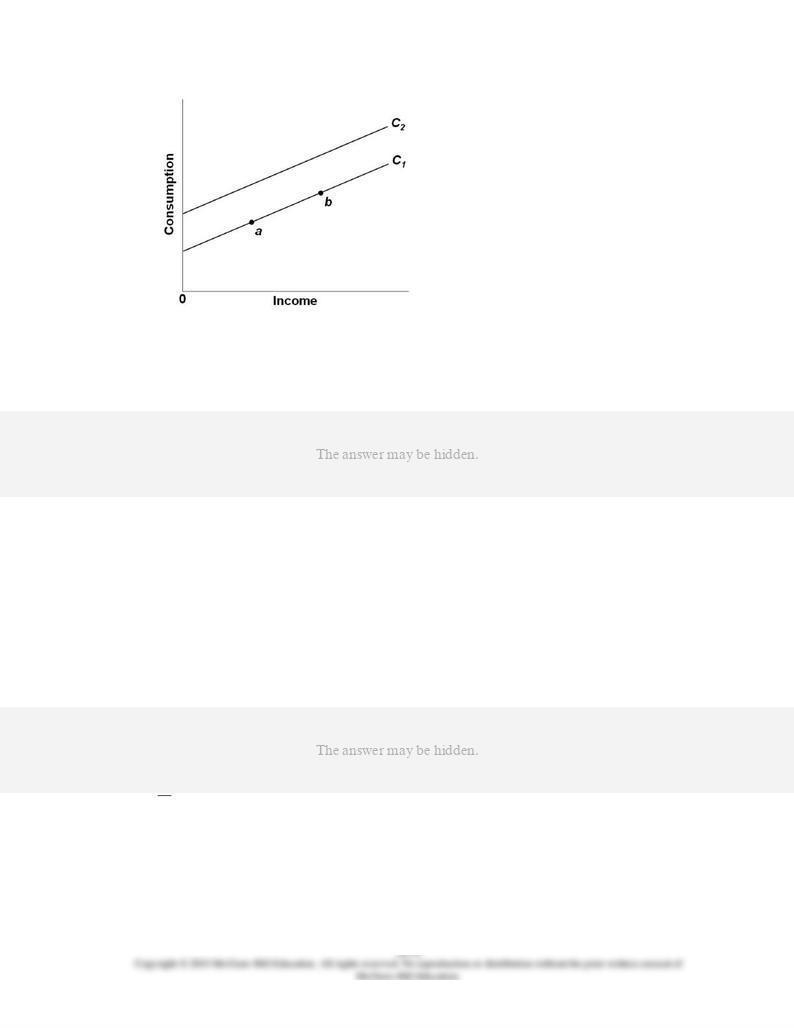
Refer to the given graph. A shift of the consumption schedule from
C
1 to
C
2 might be
caused by a(n):
AACSB: Reflective Thinking
Blooms: Analyze
Difficulty: 3 Hard
Learning Objective: 28-02 List and explain factors other than income that can affect consumption.
Topic: Nonincome determinants of consumption and saving
Type: Graph
54.
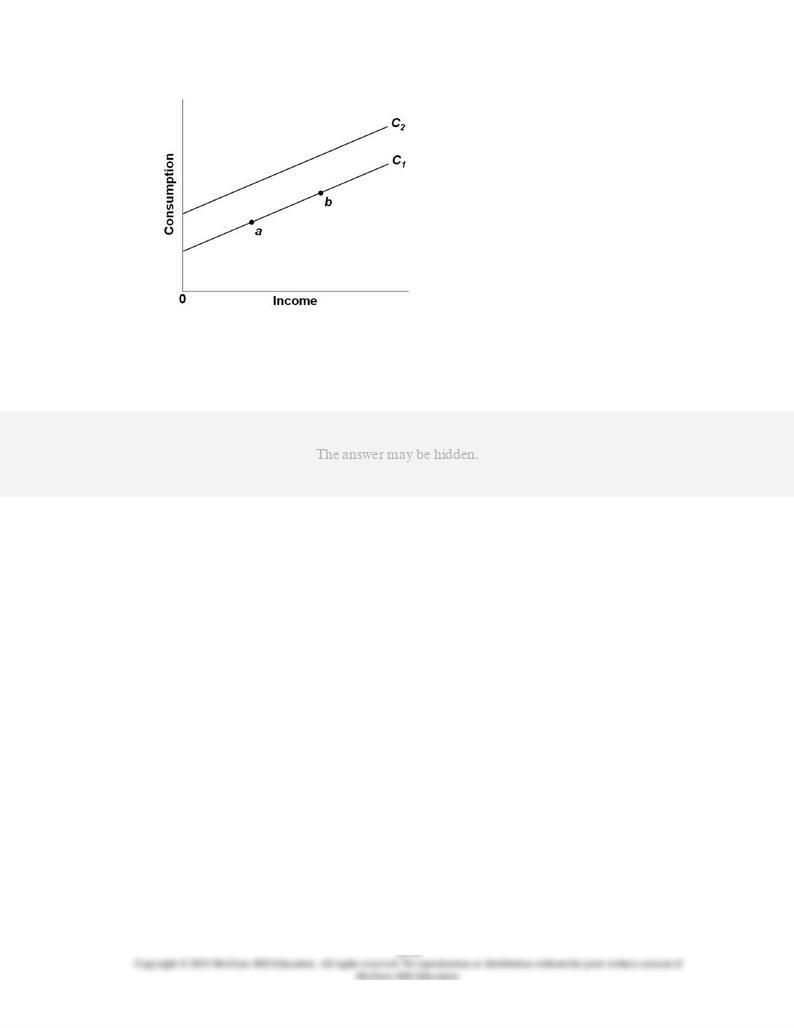
Refer to the given graph. A movement from
a
to
b
along
C
1 might be caused by a(n):
AACSB: Reflective Thinking
Blooms: Analyze
Difficulty: 3 Hard
Learning Objective: 28-02 List and explain factors other than income that can affect consumption.
Topic: Nonincome determinants of consumption and saving
Type: Graph
55.
Refer to the given graph. A shift of the consumption schedule from
C
2 to
C
1 might be
caused by a(n):
AACSB: Reflective Thinking
Blooms: Analyze
Difficulty: 3 Hard
Learning Objective: 28-02 List and explain factors other than income that can affect consumption.
Topic: Nonincome determinants of consumption and saving
Type: Graph
56.
An upward shift of the saving schedule suggests:
AACSB: Reflective Thinking
Accessibility: Keyboard Navigation
Blooms: Understand
Difficulty: 2 Medium
Learning Objective: 28-02 List and explain factors other than income that can affect consumption.
Topic: Nonincome determinants of consumption and saving

57.
Which of the following will
not
tend to shift the consumption schedule upward?
AACSB: Analytic
Accessibility: Keyboard Navigation
Blooms: Understand
Difficulty: 2 Medium
Learning Objective: 28-02 List and explain factors other than income that can affect consumption.
Topic: Nonincome determinants of consumption and saving
58.
If the consumption schedule shifts upward and the shift was
not
caused by a tax change,
the saving schedule:
AACSB: Reflective Thinking
Accessibility: Keyboard Navigation
Blooms: Understand
Difficulty: 2 Medium
Learning Objective: 28-02 List and explain factors other than income that can affect consumption.
Topic: Nonincome determinants of consumption and saving
59.
Which of the following will
not
cause the consumption schedule to shift?
AACSB: Analytic
Accessibility: Keyboard Navigation

Blooms: Understand
Difficulty: 2 Medium
Learning Objective: 28-02 List and explain factors other than income that can affect consumption.
Topic: Nonincome determinants of consumption and saving
60.
When consumption and saving are graphed relative to real GDP, an increase in personal
taxes will shift:
AACSB: Reflective Thinking
Accessibility: Keyboard Navigation
Blooms: Understand
Difficulty: 2 Medium
Learning Objective: 28-02 List and explain factors other than income that can affect consumption.
Topic: Nonincome determinants of consumption and saving
61.
If for some reason households become increasingly thrifty, we could show this by:
AACSB: Reflective Thinking
Accessibility: Keyboard Navigation
Blooms: Apply
Difficulty: 2 Medium
Learning Objective: 28-02 List and explain factors other than income that can affect consumption.
Topic: Nonincome determinants of consumption and saving
62.
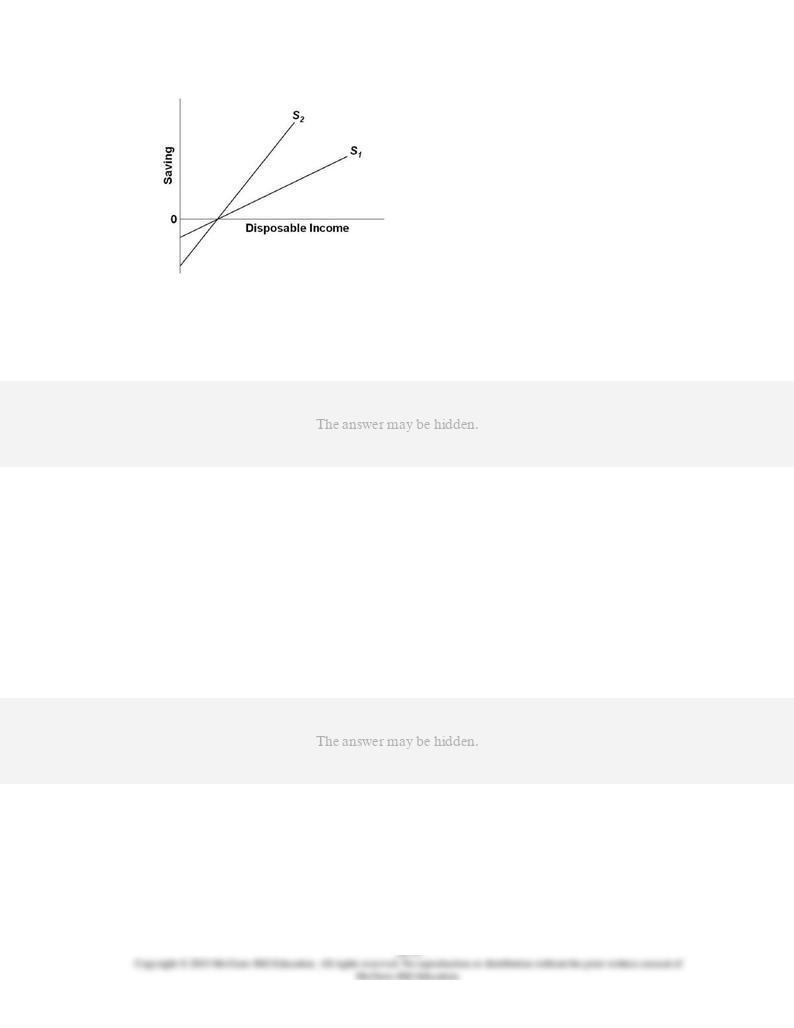
Refer to the given diagram. Suppose the economy's saving schedule shifts from
S
1 to
S
2 as
shown in the given diagram. We can say that its:
AACSB: Reflective Thinking
Blooms: Understand
Difficulty: 2 Medium
Learning Objective: 28-02 List and explain factors other than income that can affect consumption.
Topic: Nonincome determinants of consumption and saving
Type: Graph
63.
Assume the economy's consumption and saving schedules simultaneously shift downward.
This must be the result of:
AACSB: Analytic
Accessibility: Keyboard Navigation
Blooms: Understand
Difficulty: 2 Medium
Learning Objective: 28-02 List and explain factors other than income that can affect consumption.
Topic: Nonincome determinants of consumption and saving
64.
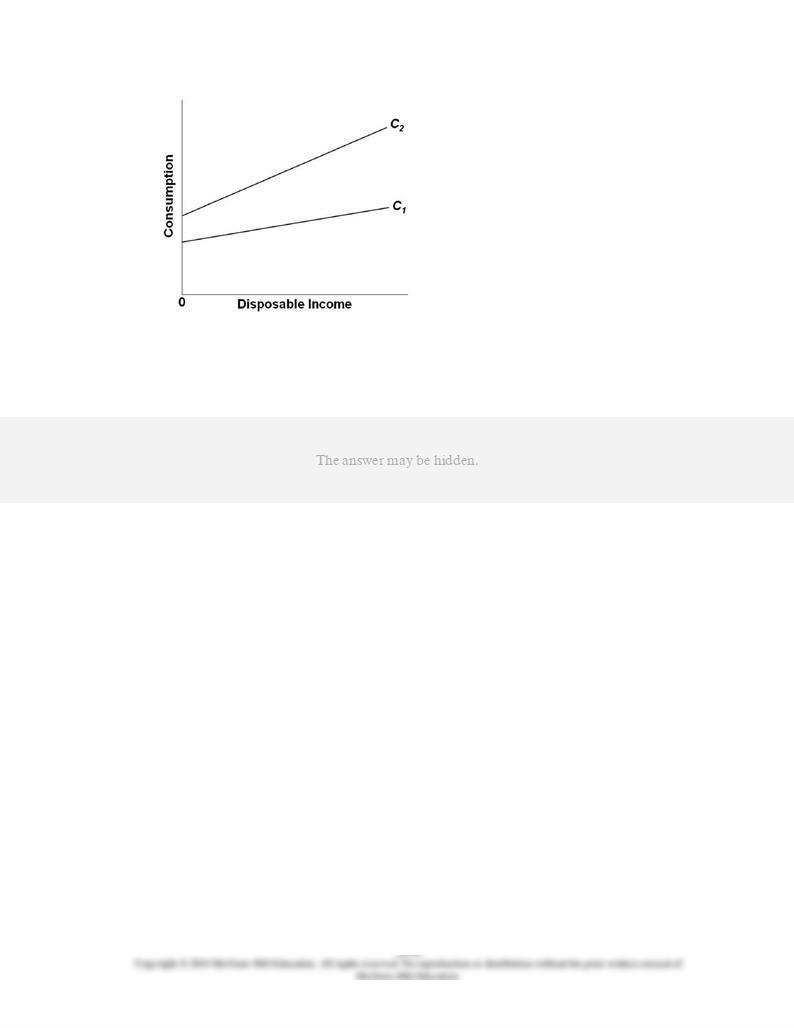
Refer to the given diagram. Suppose an economy's consumption schedule shifts from
C
1 to
C
2 as shown in the diagram. We can say that its:
AACSB: Reflective Thinking
Blooms: Understand
Difficulty: 2 Medium
Learning Objective: 28-02 List and explain factors other than income that can affect consumption.
Topic: Nonincome determinants of consumption and saving
Type: Graph
65.
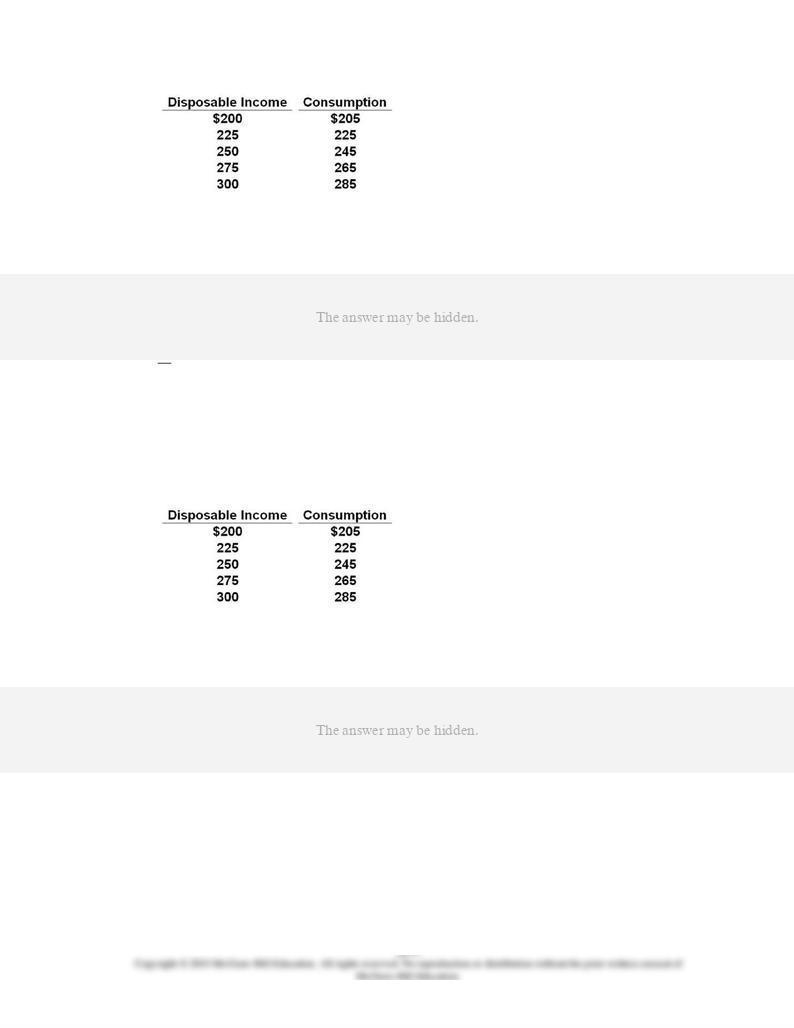
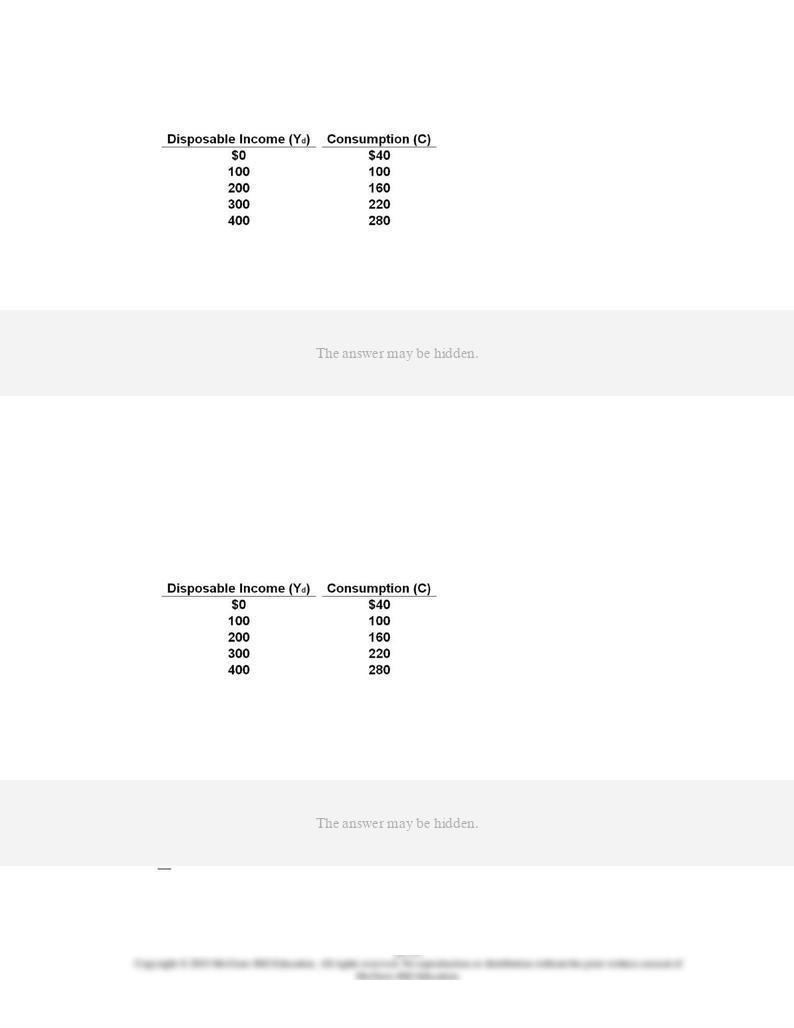
Refer to the given data. The marginal propensity to consume is:
AACSB: Analytic
Blooms: Apply
Difficulty: 2 Medium
Learning Objective: 28-02 List and explain factors other than income that can affect consumption.
Topic: Nonincome determinants of consumption and saving
Type: Table
66.
Refer to the given data. At the $200 level of disposable income:
AACSB: Analytic
Blooms: Apply
Difficulty: 2 Medium
Learning Objective: 28-02 List and explain factors other than income that can affect consumption.
Topic: Nonincome determinants of consumption and saving
Type: Table

67.
Refer to the given data. If disposable income was $325, we would expect consumption to
be:
AACSB: Analytic
Blooms: Apply
Difficulty: 2 Medium
Learning Objective: 28-02 List and explain factors other than income that can affect consumption.
Topic: Nonincome determinants of consumption and saving
Type: Table

68.
Refer to the given diagram. The marginal propensity to consume is equal to:
AACSB: Analytic
Blooms: Apply
Difficulty: 2 Medium
Learning Objective: 28-01 Describe how changes in income affect consumption (and saving).
Topic: Income-consumption and income-saving relationships
Type: Graph

69.
Refer to the given diagram. At income level
F
, the volume of saving is:
AACSB: Reflective Thinking
Blooms: Apply
Difficulty: 2 Medium
Learning Objective: 28-01 Describe how changes in income affect consumption (and saving).
Topic: Income-consumption and income-saving relationships
Type: Graph

70.
Refer to the given diagram. Consumption will be equal to income at:
AACSB: Reflective Thinking
Blooms: Apply
Difficulty: 2 Medium
Learning Objective: 28-01 Describe how changes in income affect consumption (and saving).
Topic: Income-consumption and income-saving relationships
Type: Graph
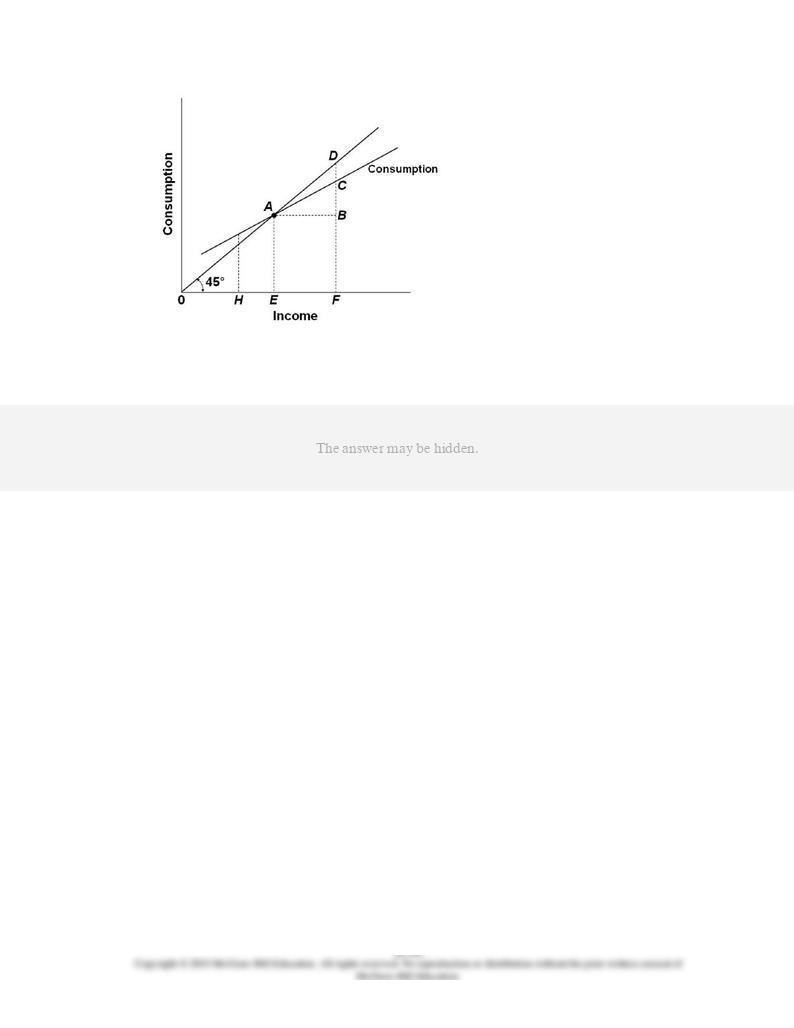
71.
Refer to the given diagram. The economy is dissaving:
AACSB: Reflective Thinking
Blooms: Apply
Difficulty: 2 Medium
Learning Objective: 28-01 Describe how changes in income affect consumption (and saving).
Topic: Income-consumption and income-saving relationships
Type: Graph

72.
Refer to the given diagram. The marginal propensity to save is:
AACSB: Analytic
Blooms: Apply
Difficulty: 2 Medium
Learning Objective: 28-01 Describe how changes in income affect consumption (and saving).
Topic: Income-consumption and income-saving relationships
Type: Graph

73.
The given figure suggests that:
AACSB: Reflective Thinking
Blooms: Apply
Difficulty: 2 Medium
Learning Objective: 28-01 Describe how changes in income affect consumption (and saving).
Topic: Income-consumption and income-saving relationships
Type: Graph
74.
Refer to the given figure. If the relevant saving schedule were constructed:
AACSB: Reflective Thinking
Blooms: Apply
Difficulty: 2 Medium
Learning Objective: 28-02 List and explain factors other than income that can affect consumption.
Topic: Nonincome determinants of consumption and saving
Type: Graph
75.
Answer the question on the basis of the following data for a hypothetical economy.
Refer to the given data. The marginal propensity to consume is:
AACSB: Analytic
Blooms: Apply
Difficulty: 2 Medium
Learning Objective: 28-01 Describe how changes in income affect consumption (and saving).
Topic: Income-consumption and income-saving relationships
Type: Table
76.
Answer the question on the basis of the following data for a hypothetical economy.
Refer to the given data. At the $100 level of income, the average propensity to save is:
AACSB: Analytic
Blooms: Apply
Difficulty: 2 Medium
Learning Objective: 28-01 Describe how changes in income affect consumption (and saving).
Topic: Income-consumption and income-saving relationships
Type: Table
77.
Answer the question on the basis of the following data for a hypothetical economy.
Refer to the given data. If plotted on a graph, the slope of the saving schedule would be:
AACSB: Analytic
Blooms: Apply
Difficulty: 2 Medium
Learning Objective: 28-01 Describe how changes in income affect consumption (and saving).
Topic: Income-consumption and income-saving relationships
Type: Table
78.
Refer to the given diagram. The marginal propensity to save is equal to:
AACSB: Analytic
Blooms: Understand
Difficulty: 2 Medium
Learning Objective: 28-01 Describe how changes in income affect consumption (and saving).
Topic: Income-consumption and income-saving relationships
Type: Graph
79.
Refer to the diagram. At disposable income level
D
, the average propensity to save is
equal to:
AACSB: Analytic
Blooms: Understand
Difficulty: 2 Medium
Learning Objective: 28-01 Describe how changes in income affect consumption (and saving).
Topic: Income-consumption and income-saving relationships
Type: Graph

80.
Refer to the diagram. At disposable income level
D
, consumption is equal to:
AACSB: Analytic
Blooms: Understand
Difficulty: 2 Medium
Learning Objective: 28-01 Describe how changes in income affect consumption (and saving).
Topic: Income-consumption and income-saving relationships
Type: Graph

81.
Refer to the diagram. Consumption equals disposable income when:
AACSB: Analytic
Blooms: Understand
Difficulty: 2 Medium
Learning Objective: 28-01 Describe how changes in income affect consumption (and saving).
Topic: Income-consumption and income-saving relationships
Type: Graph

82.
The saving schedule shown in the diagram would shift downward if, all else equal:
AACSB: Reflective Thinking
Blooms: Apply
Difficulty: 2 Medium
Learning Objective: 28-02 List and explain factors other than income that can affect consumption.
Topic: Nonincome determinants of consumption and saving
Type: Graph

83.
Answer the question on the basis of the following consumption schedules. DI signifies
disposable income and
C
represents consumption expenditures. All figures are in billions
of dollars.
Refer to the given data. The marginal propensity to consume in economy (1) is:
AACSB: Analytic
Blooms: Apply
Difficulty: 2 Medium
Learning Objective: 28-01 Describe how changes in income affect consumption (and saving).
Topic: Income-consumption and income-saving relationships
Type: Table

84.
Answer the question on the basis of the following consumption schedules. DI signifies
disposable income and
C
represents consumption expenditures. All figures are in billions
of dollars.
Refer to the given data. The marginal propensity to consume:
AACSB: Analytic
Blooms: Apply
Difficulty: 2 Medium
Learning Objective: 28-01 Describe how changes in income affect consumption (and saving).
Topic: Income-consumption and income-saving relationships
Type: Table

85.
Answer the question on the basis of the following consumption schedules. DI signifies
disposable income and
C
represents consumption expenditures. All figures are in billions
of dollars.
Refer to the given data. The marginal propensity to save:
AACSB: Analytic
Blooms: Apply
Difficulty: 2 Medium
Learning Objective: 28-01 Describe how changes in income affect consumption (and saving).
Topic: Income-consumption and income-saving relationships
Type: Table

86.
Answer the question on the basis of the following consumption schedules. DI signifies
disposable income and
C
represents consumption expenditures. All figures are in billions
of dollars.
Refer to the given data. At an income level of $40 billion, the average propensity to
consume:
AACSB: Analytic
Blooms: Apply
Difficulty: 2 Medium
Learning Objective: 28-01 Describe how changes in income affect consumption (and saving).
Topic: Income-consumption and income-saving relationships
Type: Table

87.
Answer the question on the basis of the following consumption schedules. DI signifies
disposable income and
C
represents consumption expenditures. All figures are in billions
of dollars.
Refer to the given data. At an income level of $400 billion, the average propensity to save
in economy (2) is:
AACSB: Analytic
Blooms: Apply
Difficulty: 2 Medium
Learning Objective: 28-01 Describe how changes in income affect consumption (and saving).
Topic: Income-consumption and income-saving relationships
Type: Table

88.
Answer the question on the basis of the following consumption schedules. DI signifies
disposable income and
C
represents consumption expenditures. All figures are in billions
of dollars.
(Advanced analysis) Refer to the given data. When plotted on a graph, the vertical
intercept of the consumption schedule in economy (3) is _____ and the slope is _____.
AACSB: Analytic
Blooms: Apply
Difficulty: 2 Medium
Learning Objective: 28-01 Describe how changes in income affect consumption (and saving).
Topic: Income-consumption and income-saving relationships
Type: Table

89.
Answer the question on the basis of the following consumption schedules. DI signifies
disposable income and
C
represents consumption expenditures. All figures are in billions
of dollars.
Refer to the given data. Suppose that consumption decreased by $2 billion at each level of
DI in each of the three countries. We can conclude that the:
AACSB: Analytic
Blooms: Apply
Difficulty: 2 Medium
Learning Objective: 28-02 List and explain factors other than income that can affect consumption.
Topic: Nonincome determinants of consumption and saving
Type: Table

90.
Answer the question on the basis of the following consumption schedules. DI signifies
disposable income and
C
represents consumption expenditures. All figures are in billions
of dollars.
Refer to the given data. A $2 billion increase in consumption at each level of DI could be
caused by:
AACSB: Reflective Thinking
Blooms: Apply
Difficulty: 2 Medium
Learning Objective: 28-02 List and explain factors other than income that can affect consumption.
Topic: Nonincome determinants of consumption and saving
Type: Table

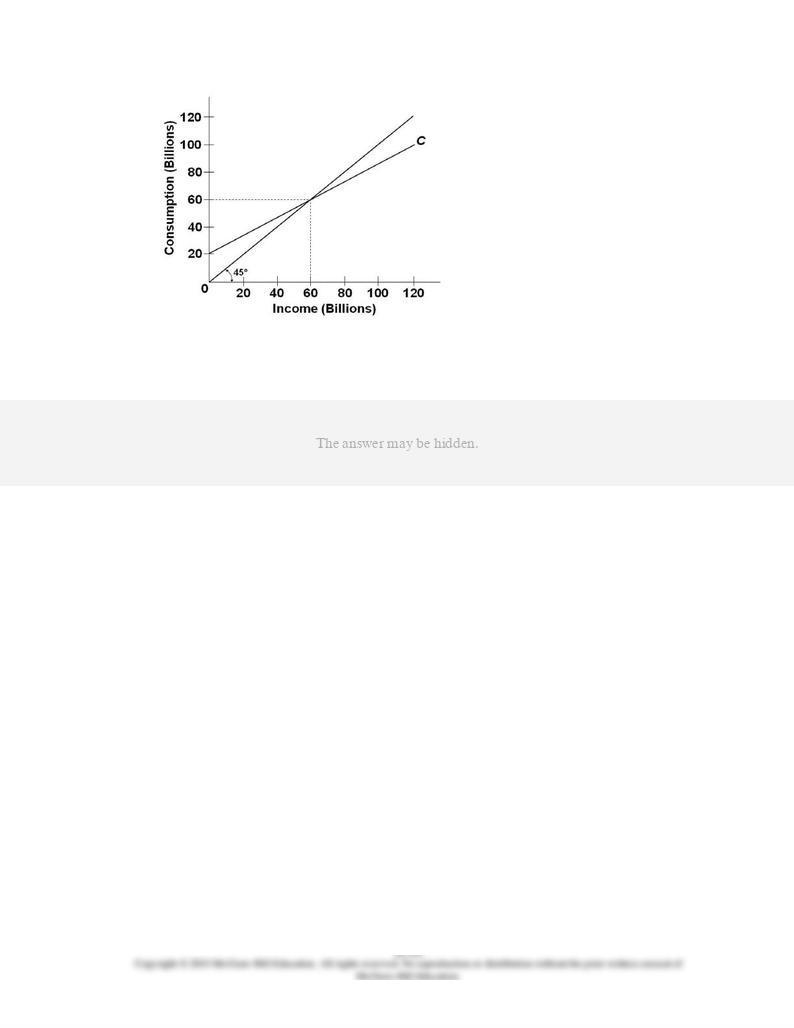
91.
Refer to the given diagram. The marginal propensity to consume is:
AACSB: Analytic
Blooms: Apply
Difficulty: 2 Medium
Learning Objective: 28-01 Describe how changes in income affect consumption (and saving).
Topic: Income-consumption and income-saving relationships
Type: Graph

92.
(Advanced analysis) The equation for the given saving schedule is:
AACSB: Analytic
Blooms: Apply
Difficulty: 2 Medium
Learning Objective: 28-01 Describe how changes in income affect consumption (and saving).
Topic: Income-consumption and income-saving relationships
Type: Graph
93.
Refer to the diagram. The average propensity to consume:
AACSB: Analytic
Blooms: Apply
Difficulty: 2 Medium
Learning Objective: 28-01 Describe how changes in income affect consumption (and saving).
Topic: Income-consumption and income-saving relationships
Type: Graph

94.
Refer to the diagram. The break-even level of income is:
AACSB: Analytic
Blooms: Apply
Difficulty: 2 Medium
Learning Objective: 28-01 Describe how changes in income affect consumption (and saving).
Topic: Income-consumption and income-saving relationships
Type: Graph
95.
Refer to the diagram. The marginal propensity to consume is:
AACSB: Analytic
Blooms: Apply
Difficulty: 2 Medium
Learning Objective: 28-01 Describe how changes in income affect consumption (and saving).
Topic: Income-consumption and income-saving relationships
Type: Graph

96.
(Advanced analysis) Refer to the diagram. The equation for the consumption schedule is:
AACSB: Analytic
Blooms: Apply
Difficulty: 2 Medium
Learning Objective: 28-01 Describe how changes in income affect consumption (and saving).
Topic: Income-consumption and income-saving relationships
Type: Graph
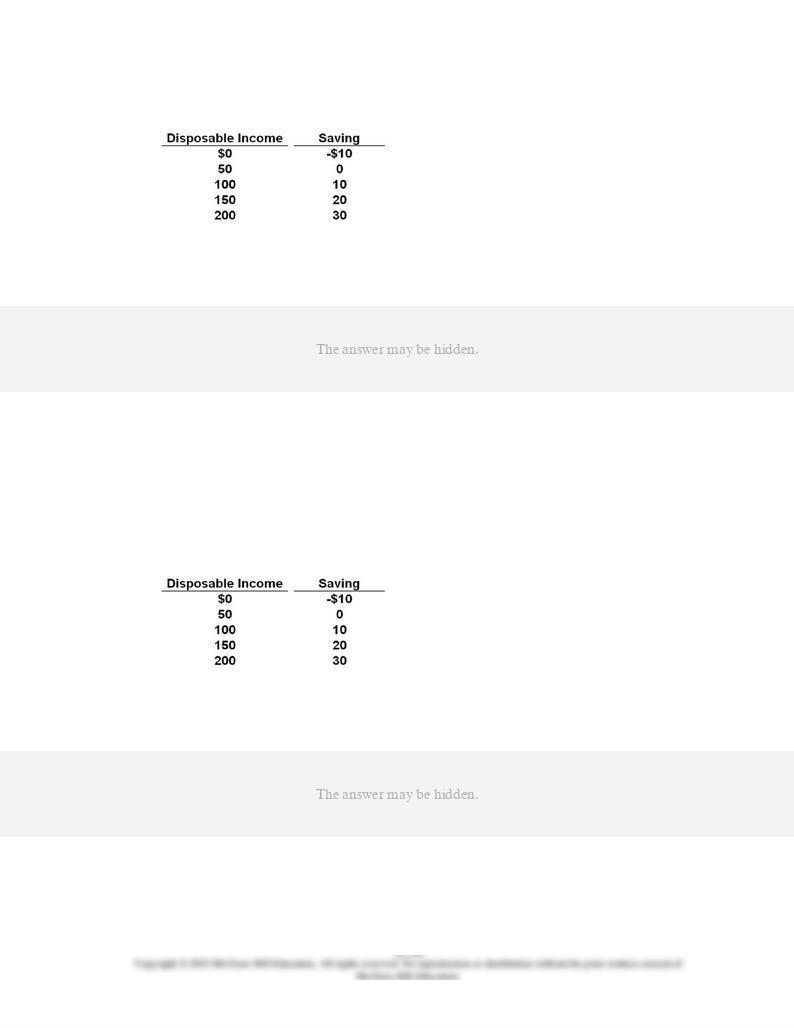
97.
(Advanced analysis) Answer the question on the basis of the following data:
Which of the following equations correctly represents the given data?
AACSB: Analytic
Blooms: Apply
Difficulty: 2 Medium
Learning Objective: 28-01 Describe how changes in income affect consumption (and saving).
Topic: Income-consumption and income-saving relationships
Type: Table
98.
(Advanced analysis) Answer the question on the basis of the following data:
Which of the following equations represents the saving schedule implicit in the given
data?
AACSB: Analytic
Blooms: Apply

Difficulty: 2 Medium
Learning Objective: 28-01 Describe how changes in income affect consumption (and saving).
Topic: Income-consumption and income-saving relationships
Type: Table
99.
The investment demand curve portrays an inverse (negative) relationship between:
AACSB: Reflective Thinking
Accessibility: Keyboard Navigation
Blooms: Understand
Difficulty: 2 Medium
Learning Objective: 28-03 Explain how changes in real interest rates affect investment.
Topic: Interest-rate-investment relationship
100.
The investment demand slopes downward and to the right because lower real interest
rates:
AACSB: Reflective Thinking
Accessibility: Keyboard Navigation
Blooms: Understand
Difficulty: 2 Medium
Learning Objective: 28-03 Explain how changes in real interest rates affect investment.
Topic: Interest-rate-investment relationship

101.
Other things equal, a decrease in the real interest rate will:
AACSB: Reflective Thinking
Accessibility: Keyboard Navigation
Blooms: Understand
Difficulty: 2 Medium
Learning Objective: 28-03 Explain how changes in real interest rates affect investment.
Topic: Interest-rate-investment relationship
102.
Suppose that a new machine tool having a useful life of only one year costs $80,000.
Suppose, also, that the net additional revenue resulting from buying this tool is expected
to be $96,000. The expected rate of return on this tool is:
AACSB: Analytic
Accessibility: Keyboard Navigation
Blooms: Apply
Difficulty: 2 Medium
Learning Objective: 28-03 Explain how changes in real interest rates affect investment.
Topic: Interest-rate-investment relationship

103.
Assume a machine that has a useful life of only one year costs $2,000. Assume, also, that
net of such operating costs as power, taxes, and so forth, the additional revenue from the
AACSB: Analytic
Accessibility: Keyboard Navigation
Blooms: Apply
Difficulty: 2 Medium
Learning Objective: 28-03 Explain how changes in real interest rates affect investment.
Topic: Interest-rate-investment relationship
104.
Assume a machine that has a useful life of only one year costs $2,000. Assume, also, that
net of such operating costs as power, taxes, and so forth, the additional revenue from the
output of this machine is expected to be $2,300. If the firm finds it can borrow funds at an
interest rate of 10 percent, the firm should:
AACSB: Analytic
Accessibility: Keyboard Navigation
Blooms: Analyze
Difficulty: 3 Hard
Learning Objective: 28-03 Explain how changes in real interest rates affect investment.
Topic: Interest-rate-investment relationship

105.
The relationship between the real interest rate and investment is shown by the:
AACSB: Analytic
Accessibility: Keyboard Navigation
Blooms: Remember
Difficulty: 1 Easy
Learning Objective: 28-03 Explain how changes in real interest rates affect investment.
Topic: Interest-rate-investment relationship
106.
Given the expected rate of return on all possible investment opportunities in the economy:
AACSB: Reflective Thinking
Accessibility: Keyboard Navigation
Blooms: Understand
Difficulty: 2 Medium
Learning Objective: 28-03 Explain how changes in real interest rates affect investment.
Topic: Interest-rate-investment relationship
107.
A decline in the real interest rate will:
AACSB: Reflective Thinking
Accessibility: Keyboard Navigation
Blooms: Understand
Difficulty: 2 Medium

Learning Objective: 28-03 Explain how changes in real interest rates affect investment.
Topic: Interest-rate-investment relationship
108.
The immediate determinants of investment spending are the:
AACSB: Analytic
Accessibility: Keyboard Navigation
Blooms: Remember
Difficulty: 1 Easy
Learning Objective: 28-03 Explain how changes in real interest rates affect investment.
Topic: Interest-rate-investment relationship
109.
The investment demand curve suggests:
AACSB: Reflective Thinking
Accessibility: Keyboard Navigation
Blooms: Understand
Difficulty: 2 Medium
Learning Objective: 28-03 Explain how changes in real interest rates affect investment.
Topic: Interest-rate-investment relationship

110.
Assume there are no prospective investment projects (I) that will yield an expected rate of
return (r) of 25 percent or more, but there are $5 billion of investment opportunities with
an expected rate of return between 20 and 25 percent, an additional $5 billion between 15
and 20 percent, and so on. The investment demand curve for this economy is:
AACSB: Analytic
Blooms: Apply
Difficulty: 2 Medium
Learning Objective: 28-03 Explain how changes in real interest rates affect investment.
Topic: Interest-rate-investment relationship

111.
Assume there are no prospective investment projects (I) that will yield an expected rate of
return (r) of 25 percent or more, but there are $5 billion of investment opportunities with
an expected rate of return between 20 and 25 percent, an additional $5 billion between 15
and 20 percent, and so on. If the real interest rate is 15 percent in this economy, the
aggregate amount of investment will be:
AACSB: Analytic
Accessibility: Keyboard Navigation
Blooms: Analyze
Difficulty: 3 Hard
Learning Objective: 28-03 Explain how changes in real interest rates affect investment.
Topic: Interest-rate-investment relationship
112.
If business taxes are reduced and the real interest rate increases:
AACSB: Reflective Thinking
Accessibility: Keyboard Navigation
Blooms: Analyze
Difficulty: 3 Hard
Learning Objective: 28-04 Identify and explain factors other than the real interest rate that can affect investment.
Topic: Shifts of the investment demand curve

113.
Other things equal, a 10 percent decrease in corporate income taxes will:
AACSB: Reflective Thinking
Accessibility: Keyboard Navigation
Blooms: Analyze
Difficulty: 3 Hard
Learning Objective: 28-04 Identify and explain factors other than the real interest rate that can affect investment.
Topic: Shifts of the investment demand curve
114.
The investment demand curve will shift to the right as the result of:
AACSB: Reflective Thinking
Accessibility: Keyboard Navigation
Blooms: Understand
Difficulty: 2 Medium
Learning Objective: 28-04 Identify and explain factors other than the real interest rate that can affect investment.
Topic: Shifts of the investment demand curve
115.
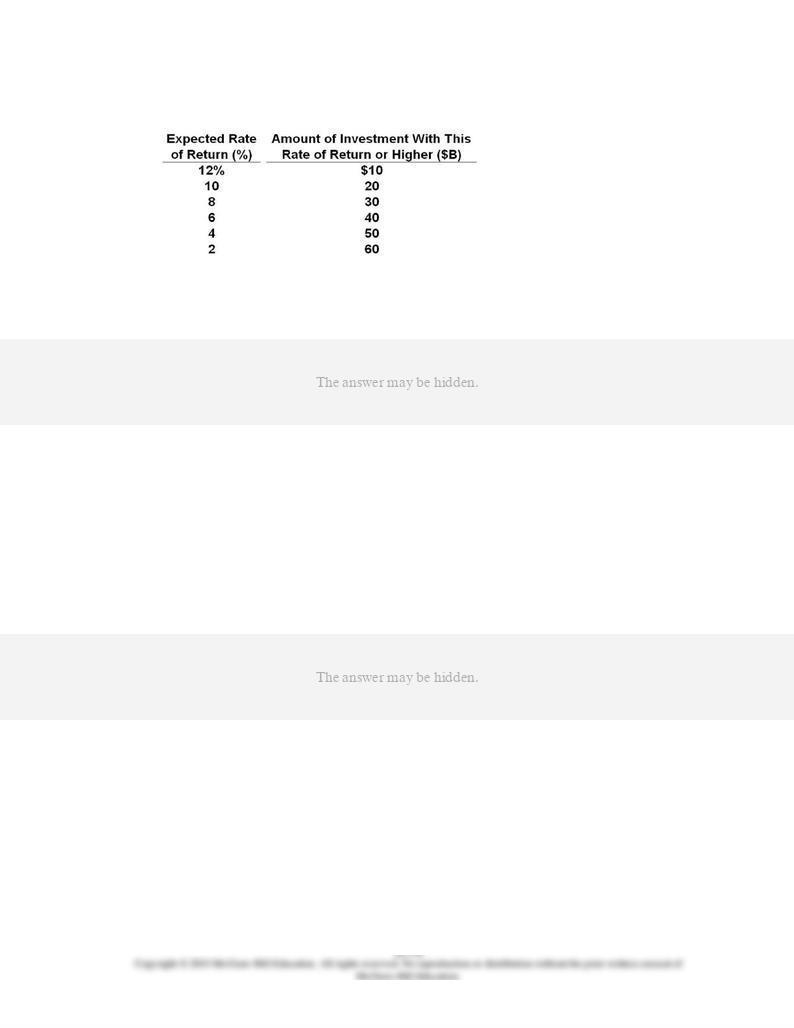
Answer the question on the basis of the following table:
The given schedule indicates that if the real interest rate is 8 percent, then:
AACSB: Analytic
Blooms: Analyze
Difficulty: 3 Hard
Learning Objective: 28-03 Explain how changes in real interest rates affect investment.
Topic: Interest-rate-investment relationship
Type: Table
116.
Other things equal, if the real interest rate falls and business taxes rise:
AACSB: Reflective Thinking
Accessibility: Keyboard Navigation
Blooms: Analyze
Difficulty: 3 Hard
Learning Objective: 28-04 Identify and explain factors other than the real interest rate that can affect investment.
Topic: Shifts of the investment demand curve

117.
The investment demand curve will shift to the right as a result of:
AACSB: Reflective Thinking
Accessibility: Keyboard Navigation
Blooms: Apply
Difficulty: 2 Medium
Learning Objective: 28-04 Identify and explain factors other than the real interest rate that can affect investment.
Topic: Shifts of the investment demand curve
118.
The investment demand curve will shift to the left as a result of:
AACSB: Reflective Thinking
Accessibility: Keyboard Navigation
Blooms: Apply
Difficulty: 2 Medium
Learning Objective: 28-04 Identify and explain factors other than the real interest rate that can affect investment.
Topic: Shifts of the investment demand curve
119.
If the real interest rate in the economy is
i
and the expected rate of return from additional
investment is
r
, then more investment will be forthcoming when:
AACSB: Reflective Thinking
Accessibility: Keyboard Navigation
Blooms: Understand

Difficulty: 2 Medium
Learning Objective: 28-03 Explain how changes in real interest rates affect investment.
Topic: Interest-rate-investment relationship
120.
A rightward shift of the investment demand curve might be caused by:
AACSB: Reflective Thinking
Accessibility: Keyboard Navigation
Blooms: Apply
Difficulty: 2 Medium
Learning Objective: 28-04 Identify and explain factors other than the real interest rate that can affect investment.
Topic: Shifts of the investment demand curve
121.
The real interest rate is:
AACSB: Analytic
Accessibility: Keyboard Navigation
Blooms: Remember
Difficulty: 1 Easy
Learning Objective: 28-03 Explain how changes in real interest rates affect investment.
Topic: Interest-rate-investment relationship

122.
When we draw an investment demand curve, we hold constant all of the following
except
:
AACSB: Analytic
Accessibility: Keyboard Navigation
Blooms: Understand
Difficulty: 2 Medium
Learning Objective: 28-03 Explain how changes in real interest rates affect investment.
Topic: Interest-rate-investment relationship
123.
If the nominal interest rate is 18 percent and the real interest rate is 6 percent, the
inflation rate is:
AACSB: Analytic
Accessibility: Keyboard Navigation
Blooms: Apply
Difficulty: 2 Medium
Learning Objective: 28-03 Explain how changes in real interest rates affect investment.
Topic: Interest-rate-investment relationship
124.
If the inflation rate is 10 percent and the real interest rate is 12 percent, the nominal
interest rate is:
AACSB: Analytic

Accessibility: Keyboard Navigation
Blooms: Apply
Difficulty: 2 Medium
Learning Objective: 28-03 Explain how changes in real interest rates affect investment.
Topic: Interest-rate-investment relationship
125.
A high rate of inflation is likely to cause a:
AACSB: Reflective Thinking
Accessibility: Keyboard Navigation
Blooms: Understand
Difficulty: 2 Medium
Learning Objective: 28-03 Explain how changes in real interest rates affect investment.
Topic: Interest-rate-investment relationship
126.
If the real interest rate in the economy is
i
and the expected rate of return on additional
investment is
r
, then other things equal:
AACSB: Reflective Thinking
Accessibility: Keyboard Navigation
Blooms: Understand
Difficulty: 2 Medium
Learning Objective: 28-03 Explain how changes in real interest rates affect investment.
Topic: Interest-rate-investment relationship

127.
If the real interest rate in the economy is
i
and the expected rate of return on additional
investment is
r
, then other things equal:
AACSB: Reflective Thinking
Accessibility: Keyboard Navigation
Blooms: Understand
Difficulty: 2 Medium
Learning Objective: 28-03 Explain how changes in real interest rates affect investment.
Topic: Interest-rate-investment relationship
128.
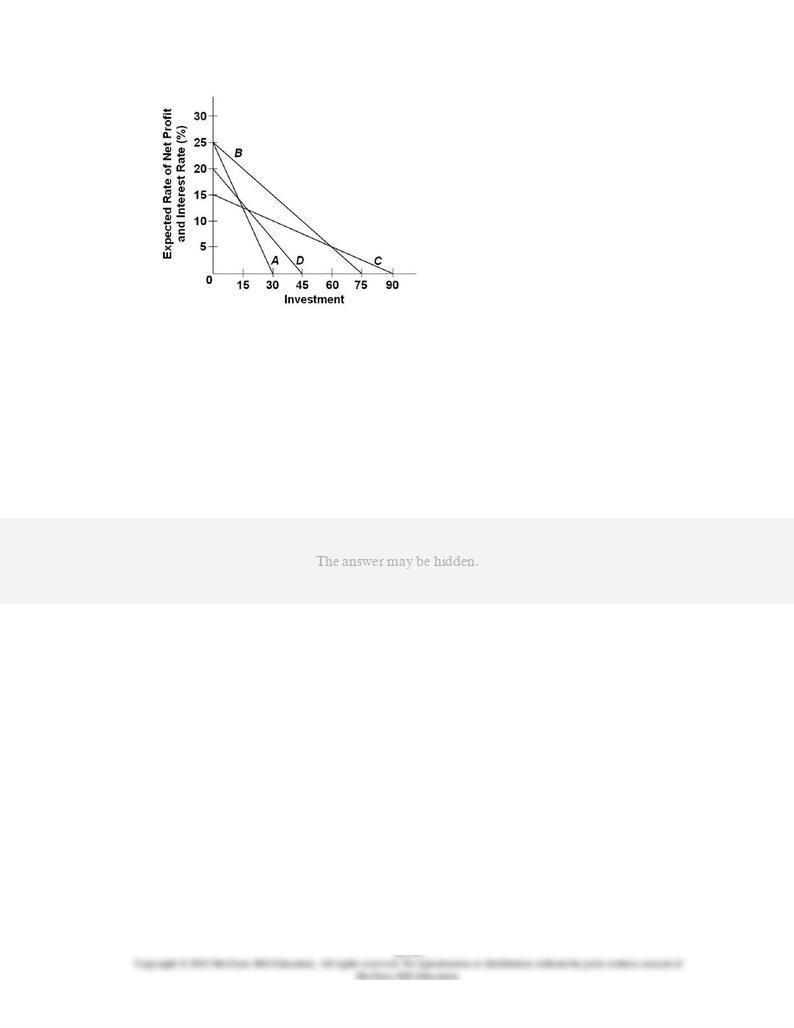
Refer to the diagram. Assume that for the entire business sector of a private closed
economy there is $0 worth of investment projects that will yield an expected rate of return
of 25 percent or more. But there are $15 worth of investments that will yield an expected
rate of return of 20-25 percent; another $15 with an expected rate of return of 15-20
percent; and similarly an additional $15 of investment projects in each successive rate of
return range down to and including the 0-5 percent range.
Which of the lines on the diagram represents these data?
AACSB: Analytic
Blooms: Apply
Difficulty: 2 Medium
Learning Objective: 28-03 Explain how changes in real interest rates affect investment.
Topic: Interest-rate-investment relationship
Type: Graph

129.
Answer the question on the basis of the following information for a private closed
economy. Assume that for the entire business sector of the economy there is $0 worth of
investment projects that will yield an expected rate of return of 25 percent or more. But
there are $15 worth of investments that will yield an expected rate of return of 20-25
percent; another $15 with an expected rate of return of 15-20 percent; and similarly an
additional $15 of investment projects in each successive rate of return range down to and
including the 0-5 percent range.
Refer to the given information. If the real interest rate is 15 percent, what amount of
investment will be undertaken?
AACSB: Analytic
Accessibility: Keyboard Navigation
Blooms: Analyze
Difficulty: 3 Hard
Learning Objective: 28-03 Explain how changes in real interest rates affect investment.
Topic: Interest-rate-investment relationship

130.
Answer the question on the basis of the following information for a private closed
economy. Assume that for the entire business sector of the economy there is $0 worth of
investment projects that will yield an expected rate of return of 25 percent or more. But
there are $15 worth of investments that will yield an expected rate of return of 20-25
percent; another $15 with an expected rate of return of 15-20 percent; and similarly an
additional $15 of investment projects in each successive rate of return range down to and
including the 0-5 percent range.
Refer to the given information. If the real interest rate is 5 percent, what amount of
investment will be undertaken?
AACSB: Analytic
Accessibility: Keyboard Navigation
Blooms: Analyze
Difficulty: 3 Hard
Learning Objective: 28-03 Explain how changes in real interest rates affect investment.
Topic: Interest-rate-investment relationship

131.
Answer the question on the basis of the following information for a private closed
economy. Assume that for the entire business sector of the economy there is $0 worth of
investment projects that will yield an expected rate of return of 25 percent or more. But
there are $15 worth of investments that will yield an expected rate of return of 20-25
percent; another $15 with an expected rate of return of 15-20 percent; and similarly an
additional $15 of investment projects in each successive rate of return range down to and
including the 0-5 percent range.
Refer to the given information. The expected rate of return curve:
AACSB: Analytic
Accessibility: Keyboard Navigation
Blooms: Understand
Difficulty: 2 Medium
Learning Objective: 28-03 Explain how changes in real interest rates affect investment.
Topic: Interest-rate-investment relationship

132.
Refer to the diagram. Which of the following would shift the investment demand curve
from
ID
1 to
ID
2?
AACSB: Reflective Thinking
Blooms: Apply
Difficulty: 2 Medium
Learning Objective: 28-04 Identify and explain factors other than the real interest rate that can affect investment.
Topic: Shifts of the investment demand curve
Type: Graph
133.
Refer to the diagram. Which of the following would shift the investment demand curve
from
ID
1 to
ID
3?
AACSB: Reflective Thinking
Blooms: Apply
Difficulty: 2 Medium
Learning Objective: 28-04 Identify and explain factors other than the real interest rate that can affect investment.
Topic: Shifts of the investment demand curve
Type: Graph
134.
Refer to the diagram. Which of the following would increase investment while leaving an
existing investment demand curve, say,
ID
2, in place?
AACSB: Reflective Thinking
Blooms: Apply
Difficulty: 2 Medium
Learning Objective: 28-03 Explain how changes in real interest rates affect investment.
Topic: Interest-rate-investment relationship
Type: Graph
135.
In annual percentage terms, investment spending in the United States is:
AACSB: Reflective Thinking
Accessibility: Keyboard Navigation
Blooms: Remember
Difficulty: 1 Easy
Learning Objective: 28-03 Explain how changes in real interest rates affect investment.
Learning Objective: 28-05 Illustrate how changes in investment (or one of the other components of total spending) can

increase or decrease real GDP by a multiple amount.
Topic: Interest-rate-investment relationship
Topic: Multiplier effect
136.
Investment spending in the United States tends to be unstable because:
AACSB: Reflective Thinking
Accessibility: Keyboard Navigation
Blooms: Understand
Difficulty: 2 Medium
Learning Objective: 28-04 Identify and explain factors other than the real interest rate that can affect investment.
Topic: Shifts of the investment demand curve
137.
Investment spending in the United States tends to be unstable because:
AACSB: Reflective Thinking
Accessibility: Keyboard Navigation
Blooms: Understand
Difficulty: 2 Medium
Learning Objective: 28-04 Identify and explain factors other than the real interest rate that can affect investment.
Topic: Shifts of the investment demand curve

138.
Capital goods, because their purchases can be postponed like ______ consumer goods,
tend to contribute to ________ in investment spending.
AACSB: Reflective Thinking
Accessibility: Keyboard Navigation
Blooms: Understand
Difficulty: 2 Medium
Learning Objective: 28-04 Identify and explain factors other than the real interest rate that can affect investment.
Topic: Shifts of the investment demand curve
139.
The multiplier effect means that:
AACSB: Analytic
Accessibility: Keyboard Navigation
Blooms: Understand
Difficulty: 2 Medium
Learning Objective: 28-05 Illustrate how changes in investment (or one of the other components of total spending) can
increase or decrease real GDP by a multiple amount.
Topic: Multiplier effect
140.
The multiplier is:
AACSB: Analytic
Accessibility: Keyboard Navigation

Blooms: Remember
Difficulty: 1 Easy
Learning Objective: 28-05 Illustrate how changes in investment (or one of the other components of total spending) can
increase or decrease real GDP by a multiple amount.
Topic: Multiplier effect
141.
The multiplier is useful in determining the:
AACSB: Analytic
Accessibility: Keyboard Navigation
Blooms: Understand
Difficulty: 2 Medium
Learning Objective: 28-05 Illustrate how changes in investment (or one of the other components of total spending) can
increase or decrease real GDP by a multiple amount.
Topic: Multiplier effect
142.
The multiplier is defined as:
AACSB: Analytic
Accessibility: Keyboard Navigation
Blooms: Remember
Difficulty: 1 Easy
Learning Objective: 28-05 Illustrate how changes in investment (or one of the other components of total spending) can
increase or decrease real GDP by a multiple amount.
Topic: Multiplier effect
143.
The figure shows the saving schedules for economies 1, 2, 3, and 4. Which economy has
the highest marginal propensity to consume?
A.
1.
B.
2.
C.
3.
AACSB: Reflective Thinking
Blooms: Apply
Difficulty: 2 Medium
Learning Objective: 28-05 Illustrate how changes in investment (or one of the other components of total spending) can
increase or decrease real GDP by a multiple amount.
Topic: Multiplier effect
Type: Graph

144.
The figure shows the saving schedules for economies 1, 2, 3, and 4. Which economy has
the largest multiplier?
A.
1.
B.
2.
C.
3.
AACSB: Reflective Thinking
Blooms: Apply
Difficulty: 2 Medium
Learning Objective: 28-05 Illustrate how changes in investment (or one of the other components of total spending) can
increase or decrease real GDP by a multiple amount.
Topic: Multiplier effect
Type: Graph
145.
If 100 percent of any change in income is spent, the multiplier will be:
B.
1.
C.
zero.
AACSB: Analytic
Accessibility: Keyboard Navigation
Blooms: Understand
Difficulty: 2 Medium
Learning Objective: 28-05 Illustrate how changes in investment (or one of the other components of total spending) can

increase or decrease real GDP by a multiple amount.
Topic: Multiplier effect
146.
The multiplier can be calculated as:
AACSB: Analytic
Accessibility: Keyboard Navigation
Blooms: Remember
Difficulty: 1 Easy
Learning Objective: 28-05 Illustrate how changes in investment (or one of the other components of total spending) can
increase or decrease real GDP by a multiple amount.
Topic: Multiplier effect
147.
The size of the multiplier is equal to the:
AACSB: Analytic
Accessibility: Keyboard Navigation
Blooms: Understand
Difficulty: 2 Medium
Learning Objective: 28-05 Illustrate how changes in investment (or one of the other components of total spending) can
increase or decrease real GDP by a multiple amount.
Topic: Multiplier effect

148.
If the MPS is only half as large as the MPC, the multiplier is:
A.
2.
C.
4.
D.
5.
AACSB: Analytic
Accessibility: Keyboard Navigation
Blooms: Apply
Difficulty: 2 Medium
Learning Objective: 28-05 Illustrate how changes in investment (or one of the other components of total spending) can
increase or decrease real GDP by a multiple amount.
Topic: Multiplier effect
149.
If the MPC is .70 and investment increases by $3 billion, the equilibrium GDP will:
AACSB: Analytic
Accessibility: Keyboard Navigation
Blooms: Apply
Difficulty: 2 Medium
Learning Objective: 28-05 Illustrate how changes in investment (or one of the other components of total spending) can
increase or decrease real GDP by a multiple amount.
Topic: Multiplier effect
150.
The numerical value of the multiplier will be smaller the:
AACSB: Reflective Thinking
Accessibility: Keyboard Navigation

Blooms: Understand
Difficulty: 2 Medium
Learning Objective: 28-05 Illustrate how changes in investment (or one of the other components of total spending) can
increase or decrease real GDP by a multiple amount.
Topic: Multiplier effect
151.
The practical significance of the multiplier is that it:
AACSB: Reflective Thinking
Accessibility: Keyboard Navigation
Blooms: Understand
Difficulty: 2 Medium
Learning Objective: 28-05 Illustrate how changes in investment (or one of the other components of total spending) can
increase or decrease real GDP by a multiple amount.
Topic: Multiplier effect
152.
If the MPC is .6, the multiplier will be:
A.
4.0.
B.
6.0.
D.
1.67.
AACSB: Analytic
Accessibility: Keyboard Navigation
Blooms: Apply
Difficulty: 2 Medium
Learning Objective: 28-05 Illustrate how changes in investment (or one of the other components of total spending) can
increase or decrease real GDP by a multiple amount.
Topic: Multiplier effect

153.
Assume the MPC is 2/3. If investment spending increases by $2 billion, the level of GDP
will increase by:
AACSB: Analytic
Accessibility: Keyboard Navigation
Blooms: Apply
Difficulty: 2 Medium
Learning Objective: 28-05 Illustrate how changes in investment (or one of the other components of total spending) can
increase or decrease real GDP by a multiple amount.
Topic: Multiplier effect
154.
The multiplier applies to:
AACSB: Reflective Thinking
Accessibility: Keyboard Navigation
Blooms: Understand
Difficulty: 2 Medium
Learning Objective: 28-05 Illustrate how changes in investment (or one of the other components of total spending) can
increase or decrease real GDP by a multiple amount.
Topic: Multiplier effect
155.
The multiplier effect indicates that:
AACSB: Analytic
Accessibility: Keyboard Navigation
Blooms: Understand
Difficulty: 2 Medium
Learning Objective: 28-05 Illustrate how changes in investment (or one of the other components of total spending) can
increase or decrease real GDP by a multiple amount.
Topic: Multiplier effect
156.
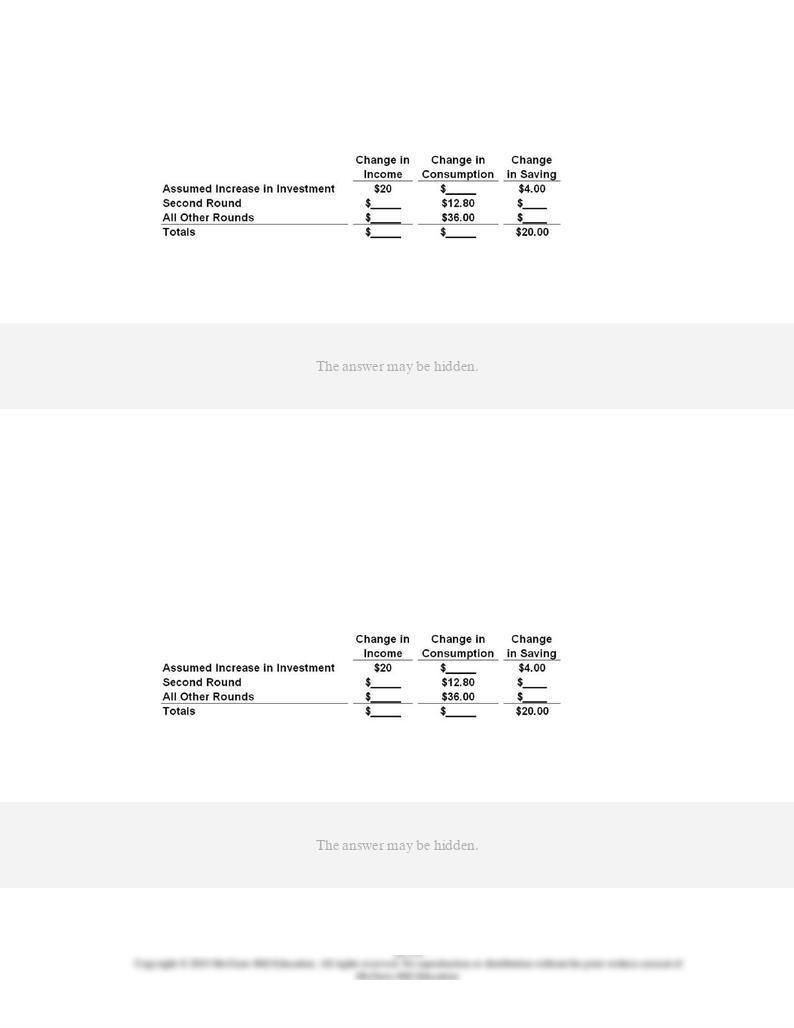
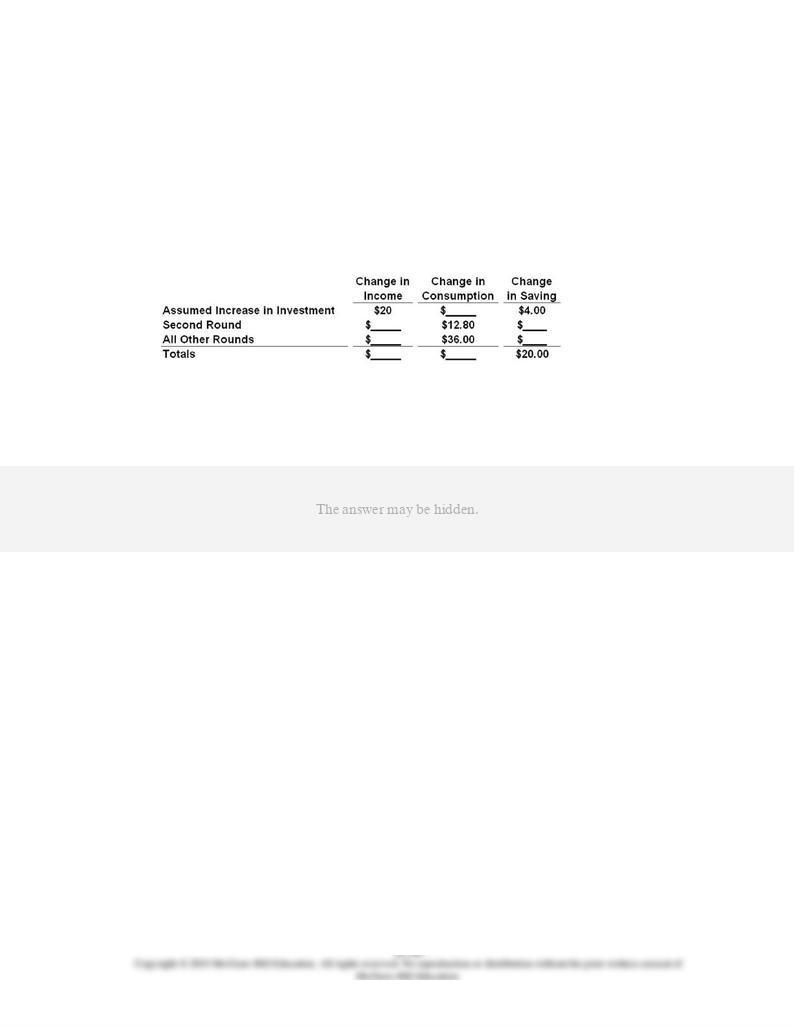
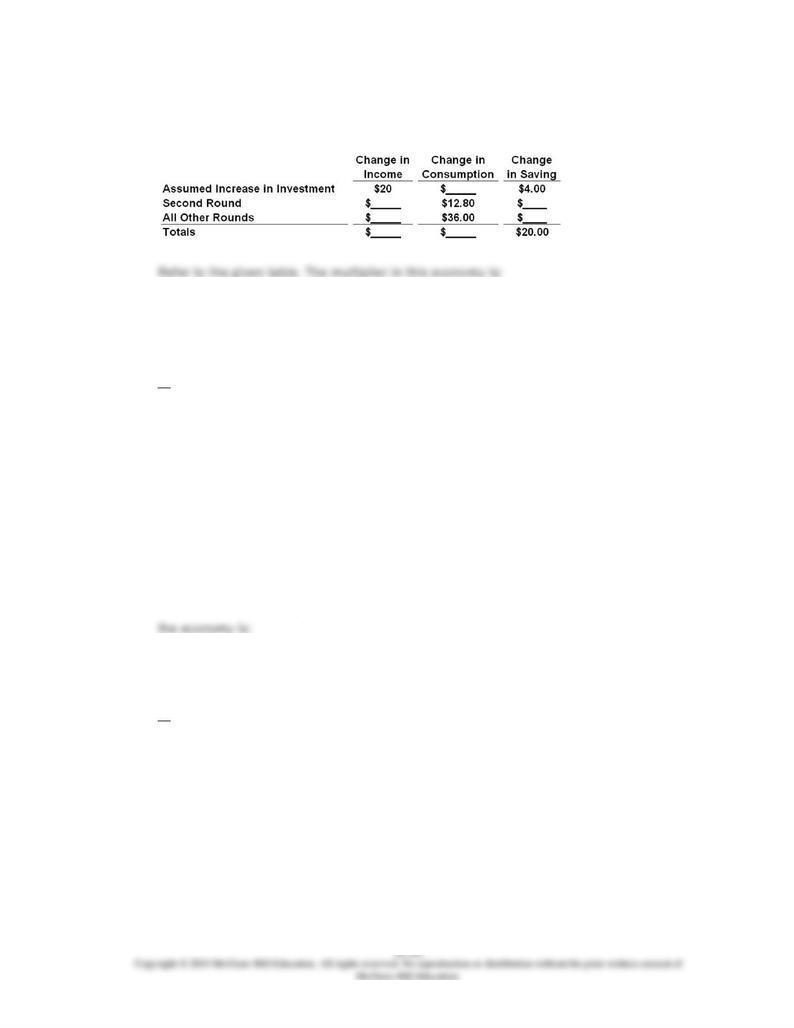
Answer the question on the basis of the following table that illustrates the multiplier
process.
Refer to the given table. The marginal propensity to consume is:
AACSB: Analytic
Blooms: Apply
Difficulty: 2 Medium
Learning Objective: 28-05 Illustrate how changes in investment (or one of the other components of total spending) can
increase or decrease real GDP by a multiple amount.
Topic: Multiplier effect
Type: Table
157.
Answer the question on the basis of the following table that illustrates the multiplier
process.
Refer to the given table. The marginal propensity to save is:
AACSB: Analytic
Blooms: Apply
Difficulty: 2 Medium
Learning Objective: 28-05 Illustrate how changes in investment (or one of the other components of total spending) can
increase or decrease real GDP by a multiple amount.
Topic: Multiplier effect
Type: Table
158.
Answer the question on the basis of the following table that illustrates the multiplier
process.
Refer to the given table. The change in income in round two will be:
AACSB: Analytic
Blooms: Apply
Difficulty: 2 Medium
Learning Objective: 28-05 Illustrate how changes in investment (or one of the other components of total spending) can
increase or decrease real GDP by a multiple amount.
Topic: Multiplier effect
Type: Table
159.
Answer the question on the basis of the following table that illustrates the multiplier
process.
Refer to the given table. The total change in income resulting from the initial change in
investment will be:
AACSB: Analytic
Blooms: Apply
Difficulty: 2 Medium
Learning Objective: 28-05 Illustrate how changes in investment (or one of the other components of total spending) can
increase or decrease real GDP by a multiple amount.
Topic: Multiplier effect
Type: Table

160.
Answer the question on the basis of the following table that illustrates the multiplier
process.
Refer to the given table. The total change in consumption resulting from the initial change
in investment will be:
AACSB: Analytic
Blooms: Apply
Difficulty: 2 Medium
Learning Objective: 28-05 Illustrate how changes in investment (or one of the other components of total spending) can
increase or decrease real GDP by a multiple amount.
Topic: Multiplier effect
Type: Table
161.
Answer the question on the basis of the following table that illustrates the multiplier
process.
A.
2.
B.
4.
C.
5.
D.
10.
AACSB: Analytic
Blooms: Apply
Difficulty: 2 Medium
Learning Objective: 28-05 Illustrate how changes in investment (or one of the other components of total spending) can
increase or decrease real GDP by a multiple amount.
Topic: Multiplier effect
Type: Table
162.
If a $200 billion increase in investment spending creates $200 billion of new income in the
first round of the multiplier process and $160 billion in the second round, the multiplier in
A.
4.
B.
5.
C.
3.33.
D.
2.5.
AACSB: Analytic
Accessibility: Keyboard Navigation
Blooms: Apply
Difficulty: 2 Medium
Learning Objective: 28-05 Illustrate how changes in investment (or one of the other components of total spending) can
increase or decrease real GDP by a multiple amount.
Topic: Multiplier effect

163.
If a $50 billion decrease in investment spending causes income to decline by $50 billion in
the first round of the multiplier process and by $25 in the second round, the multiplier in
A.
2.
B.
3.33.
C.
5.
D.
10.
AACSB: Analytic
Accessibility: Keyboard Navigation
Blooms: Apply
Difficulty: 2 Medium
Learning Objective: 28-05 Illustrate how changes in investment (or one of the other components of total spending) can
increase or decrease real GDP by a multiple amount.
Topic: Multiplier effect
164.
If a $100 billion decrease in investment spending causes income to decline by $100 billion
in the first round of the multiplier process and by $75 billion in the second round, income
will eventually decline by:
AACSB: Analytic
Accessibility: Keyboard Navigation
Blooms: Apply
Difficulty: 2 Medium
Learning Objective: 28-05 Illustrate how changes in investment (or one of the other components of total spending) can
increase or decrease real GDP by a multiple amount.
Topic: Multiplier effect

165.
If a $500 billion increase in investment spending increases income by $500 billion in the
first round of the multiplier process and by $450 in the second round, income will
eventually increase by:
AACSB: Analytic
Accessibility: Keyboard Navigation
Blooms: Apply
Difficulty: 2 Medium
Learning Objective: 28-05 Illustrate how changes in investment (or one of the other components of total spending) can
increase or decrease real GDP by a multiple amount.
Topic: Multiplier effect
166.
If the marginal propensity to save is 0.2 in an economy, a $20 billion rise in investment
spending will increase:
AACSB: Analytic
Accessibility: Keyboard Navigation
Blooms: Apply
Difficulty: 2 Medium
Learning Objective: 28-05 Illustrate how changes in investment (or one of the other components of total spending) can
increase or decrease real GDP by a multiple amount.
Topic: Multiplier effect

167.
A $1 billion increase in investment will cause a:
AACSB: Analytic
Accessibility: Keyboard Navigation
Blooms: Understand
Difficulty: 2 Medium
Learning Objective: 28-05 Illustrate how changes in investment (or one of the other components of total spending) can
increase or decrease real GDP by a multiple amount.
Topic: Multiplier effect
168.
The actual multiplier effect in the U.S. economy is less than the multiplier effect in the text
examples because:
AACSB: Reflective Thinking
Accessibility: Keyboard Navigation
Blooms: Understand
Difficulty: 2 Medium
Learning Objective: 28-05 Illustrate how changes in investment (or one of the other components of total spending) can
increase or decrease real GDP by a multiple amount.
Topic: Multiplier effect

169.
(Consider This) During the Great Recession of 2007-2009, both real interest rates and
investment spending declined. This suggests that:
AACSB: Reflective Thinking
Accessibility: Keyboard Navigation
Blooms: Apply
Difficulty: 2 Medium
Learning Objective: 28-03 Explain how changes in real interest rates affect investment.
Learning Objective: 28-04 Identify and explain factors other than the real interest rate that can affect investment.
Topic: Interest-rate-investment relationship
Topic: Shifts of the investment demand curve
170.
(Consider This) During the Great Recession of 2007-2009:
AACSB: Reflective Thinking
Accessibility: Keyboard Navigation
Blooms: Apply
Difficulty: 2 Medium
Learning Objective: 28-03 Explain how changes in real interest rates affect investment.
Topic: Interest-rate-investment relationship

171.
(Last Word) Art Buchwald's article "Squaring the Economic Circle" is a humorous
description of:
AACSB: Reflective Thinking
Accessibility: Keyboard Navigation
Blooms: Understand
Difficulty: 2 Medium
Learning Objective: 28-05 Illustrate how changes in investment (or one of the other components of total spending) can
increase or decrease real GDP by a multiple amount.
Topic: Multiplier effect
172.
(Last Word) Art Buchwald's article "Squaring the Economic Circle" humorously describes
how:
AACSB: Reflective Thinking
Accessibility: Keyboard Navigation
Blooms: Understand
Difficulty: 2 Medium
Learning Objective: 28-05 Illustrate how changes in investment (or one of the other components of total spending) can
increase or decrease real GDP by a multiple amount.
Topic: Multiplier effect
True / False Questions

173.
If DI is $275 billion and the APC is 0.8, we can conclude that saving is $55 billion.
AACSB: Reflective Thinking
Accessibility: Keyboard Navigation
Blooms: Understand
Difficulty: 2 Medium
Learning Objective: 28-01 Describe how changes in income affect consumption (and saving).
Topic: Income-consumption and income-saving relationships
174.
If the MPC is constant at various levels of income, then the APC must also be constant at
all of those income levels.
AACSB: Reflective Thinking
Accessibility: Keyboard Navigation
Blooms: Understand
Difficulty: 2 Medium
Learning Objective: 28-01 Describe how changes in income affect consumption (and saving).
Topic: Income-consumption and income-saving relationships
175.
The average propensity to consume is defined as income divided by consumption.
AACSB: Analytic
Accessibility: Keyboard Navigation
Blooms: Remember
Difficulty: 1 Easy
Learning Objective: 28-01 Describe how changes in income affect consumption (and saving).
Topic: Income-consumption and income-saving relationships
176.
1 - MPC = MPS.
AACSB: Analytic
Accessibility: Keyboard Navigation
Blooms: Remember
Difficulty: 1 Easy
Learning Objective: 28-01 Describe how changes in income affect consumption (and saving).
Topic: Income-consumption and income-saving relationships

177.
If the Hennige family's marginal propensity to consume is .70, then it will necessarily
consume seven-tenths of its total income.
AACSB: Analytic
Accessibility: Keyboard Navigation
Blooms: Apply
Difficulty: 2 Medium
Learning Objective: 28-01 Describe how changes in income affect consumption (and saving).
Topic: Income-consumption and income-saving relationships
178.
1 + MPS = MPC.
AACSB: Analytic
Accessibility: Keyboard Navigation
Blooms: Remember
Difficulty: 1 Easy
Learning Objective: 28-01 Describe how changes in income affect consumption (and saving).
Topic: Income-consumption and income-saving relationships
179.
The slope of the consumption schedule is measured by the MPC.
AACSB: Analytic
Accessibility: Keyboard Navigation
Blooms: Remember
Difficulty: 1 Easy
Learning Objective: 28-01 Describe how changes in income affect consumption (and saving).
Topic: Income-consumption and income-saving relationships
180.
A decline in the real interest rate will shift the investment demand curve to the right.
AACSB: Reflective Thinking
Accessibility: Keyboard Navigation
Blooms: Understand
Difficulty: 2 Medium
Learning Objective: 28-03 Explain how changes in real interest rates affect investment.

Topic: Interest-rate-investment relationship
181.
A specific investment will be undertaken if the expected rate of return,
r
, exceeds the
interest rate,
i
.
AACSB: Reflective Thinking
Accessibility: Keyboard Navigation
Blooms: Understand
Difficulty: 2 Medium
Learning Objective: 28-03 Explain how changes in real interest rates affect investment.
Topic: Interest-rate-investment relationship
182.
Investment is highly stable; it increases over time at a very steady rate.
AACSB: Reflective Thinking
Accessibility: Keyboard Navigation
Blooms: Remember
Difficulty: 1 Easy
Learning Objective: 28-03 Explain how changes in real interest rates affect investment.
Learning Objective: 28-04 Identify and explain factors other than the real interest rate that can affect investment.
Topic: Interest-rate-investment relationship
Topic: Shifts of the investment demand curve
183.
The greater the MPC, the greater the multiplier.
AACSB: Reflective Thinking
Accessibility: Keyboard Navigation
Blooms: Understand
Difficulty: 2 Medium
Learning Objective: 28-05 Illustrate how changes in investment (or one of the other components of total spending) can
increase or decrease real GDP by a multiple amount.
Topic: Multiplier effect
184.
The multiplier is equal to the reciprocal of the MPC.
AACSB: Analytic

Accessibility: Keyboard Navigation
Blooms: Remember
Difficulty: 1 Easy
Learning Objective: 28-05 Illustrate how changes in investment (or one of the other components of total spending) can
increase or decrease real GDP by a multiple amount.
Topic: Multiplier effect
185.
The multiplier shows the relationship between changes in a component of spending, say,
investment, and the consequent changes in real income and output.
AACSB: Reflective Thinking
Accessibility: Keyboard Navigation
Blooms: Understand
Difficulty: 2 Medium
Learning Objective: 28-05 Illustrate how changes in investment (or one of the other components of total spending) can
increase or decrease real GDP by a multiple amount.
Topic: Multiplier effect
186.
Economists widely agree that the value of the real-world multiplier is 2.5.
AACSB: Analytic
Accessibility: Keyboard Navigation
Blooms: Remember
Difficulty: 1 Easy
Learning Objective: 28-05 Illustrate how changes in investment (or one of the other components of total spending) can
increase or decrease real GDP by a multiple amount.
Topic: Multiplier effect
187.
If the MPC is .9 and investment spending increases by $20 billion, real GDP will increase
by $200 billion.
AACSB: Analytic
Accessibility: Keyboard Navigation
Blooms: Apply
Difficulty: 2 Medium
Learning Objective: 28-05 Illustrate how changes in investment (or one of the other components of total spending) can
increase or decrease real GDP by a multiple amount.
Topic: Multiplier effect