CHAPTER 11--PERFORMANCE AND STRATEGY IN
COMPETITIVE MARKETS
Student: ___________________________________________________________________________


25. Above-normal returns earned in the time interval that exists between when a favorable influence on industry
demand or cost conditions first transpires and the time when competitor entry or growth finally develops are
26. Social Welfare Concepts. Indicate whether each of the following statements is true or false, and explain
why.
27. Competitive Market Equilibrium. Suppose demand and supply conditions in the competitive market for
unskilled labor are as follows:

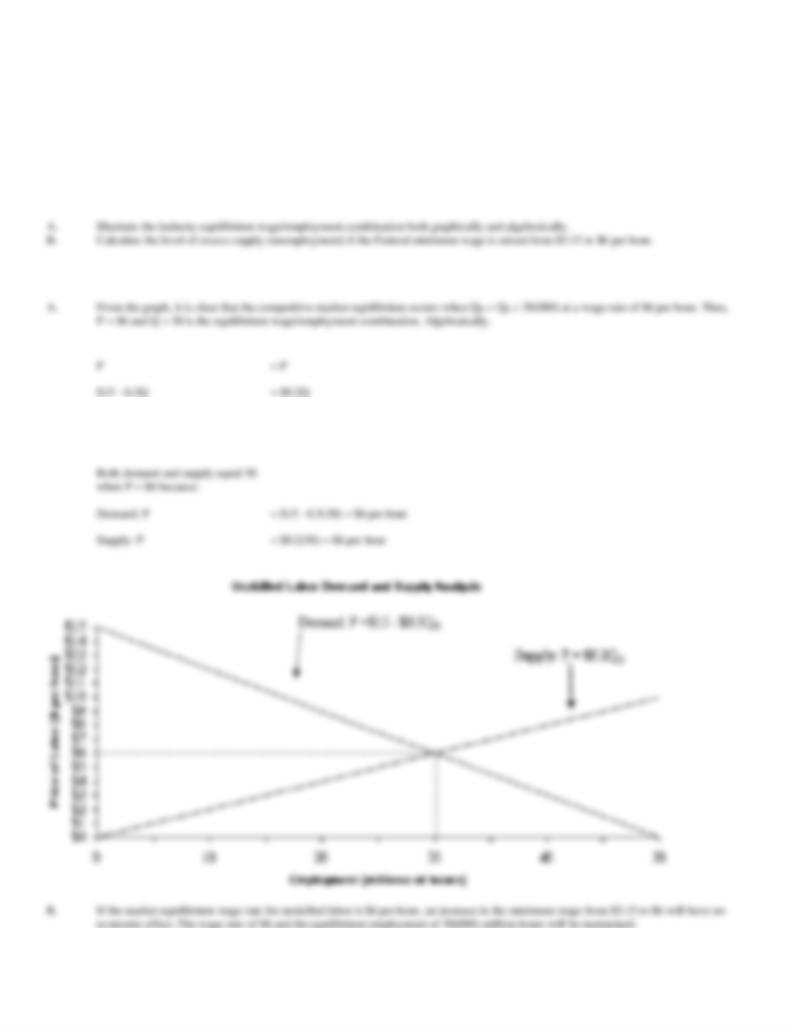
28. Competitive Market Equilibrium. Assume demand and supply conditions in the competitive market for
unskilled labor are as follows:
P
= $15 - 0.3QD
(Demand)
P
= $0.2QS
(Supply)
where Q is millions of hours of unskilled labor and P is the wage rate per hour.
A.
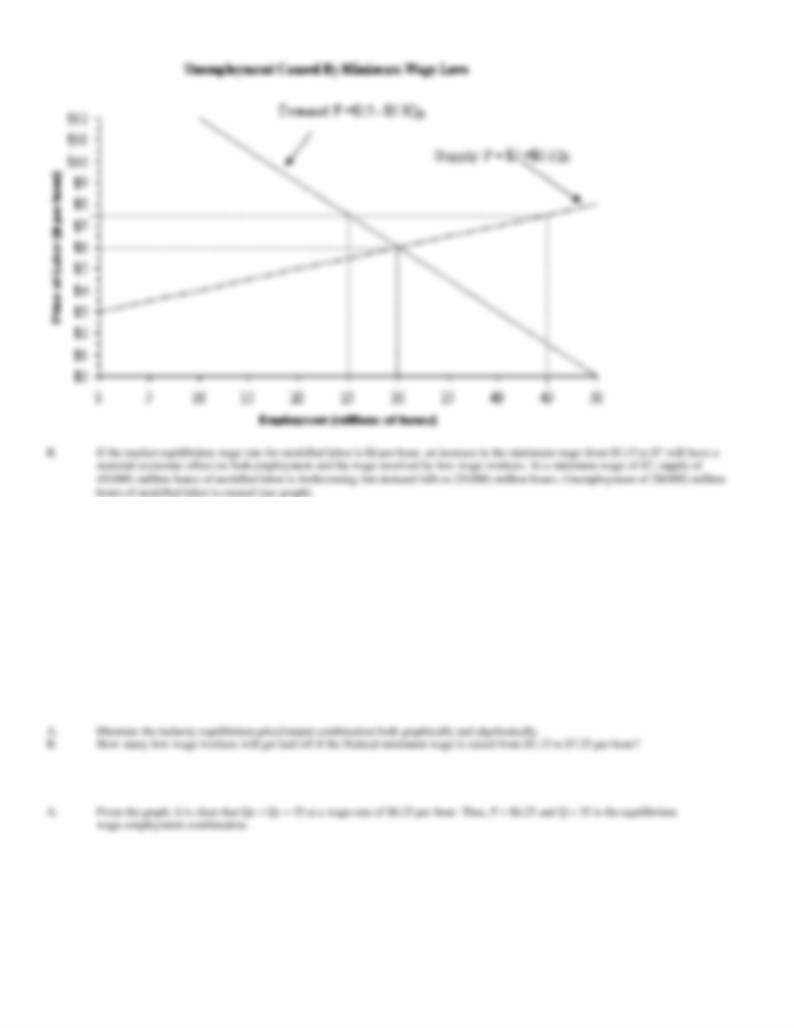
Illustrate the industry equilibrium wage/employment combination both graphically and algebraically.
B.
Calculate the level of excess supply (unemployment) if the Federal minimum wage is raised from $5.15 to $6 per hour.
29. Competitive Market Surplus. Suppose demand and supply conditions in the competitive market for
unskilled labor are as follows:
P
= $15 - 0.3QD
(Demand)
P
= $3 + $0.1QS
(Supply)
where Q is millions of hours of unskilled labor and P is the wage rate per hour.
A.
Illustrate the industry equilibrium wage/employment combination both graphically and algebraically.
B.
Calculate the level of excess supply (unemployment) if the Federal minimum wage is raised from $5.15 to $7 per hour.

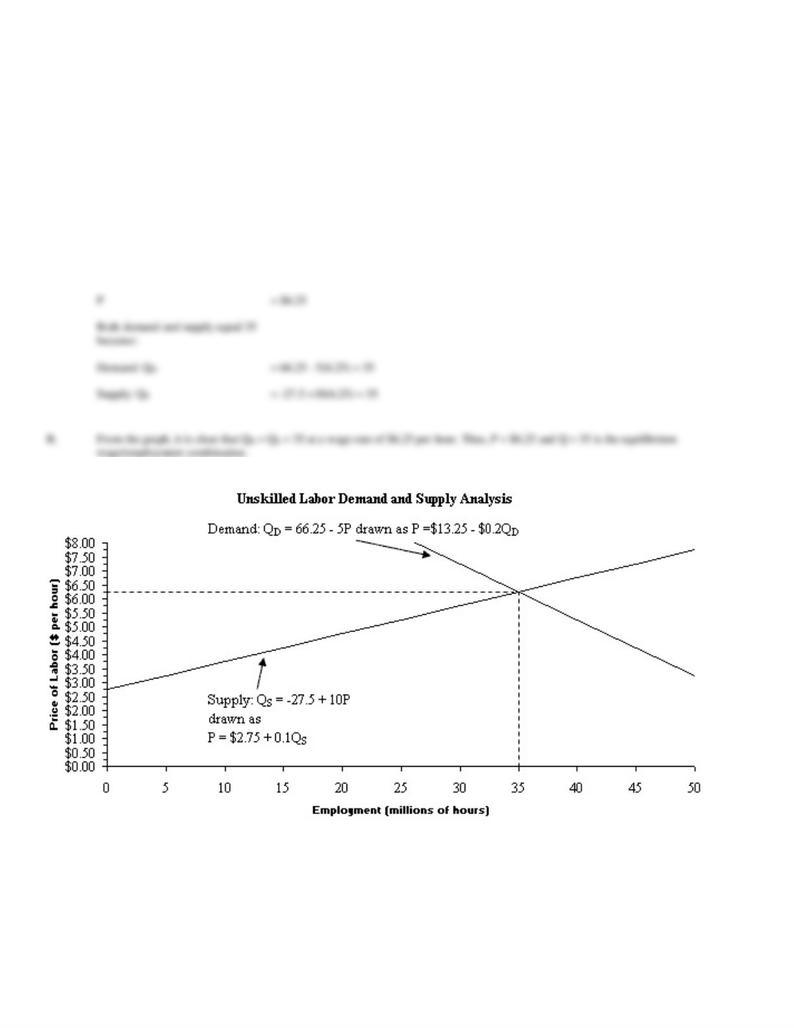
30. Competitive Market Surplus. Assume demand and supply conditions in the competitive market for
unskilled labor are as follows:
QD
= 66.25 - 5P
(Demand)
QS
= -27.5 + 10P
(Supply)
where Q is millions of hours of unskilled labor and P is the wage rate per hour.
A.
Illustrate the industry equilibrium price/output combination both graphically and algebraically.
B.
How many low-wage workers will get laid off if the Federal minimum wage is raised from $5.15 to $7.25 per hour?
31. Per Unit Tax and Elastic Demand. Assume that the supply of tickets to an outdoor music festival in
Thousand Oaks, California, is a function of price such that:
QS
= 1P
(Supply)
where Q is the number of tickets (in thousands) and P is the ticket price. Also assume that the demand for such concert tickets is perfectly elastic at a
price of $30. This means that the ticket demand curve can be drawn as a horizontal line that passes through $30 on the Y-axis.
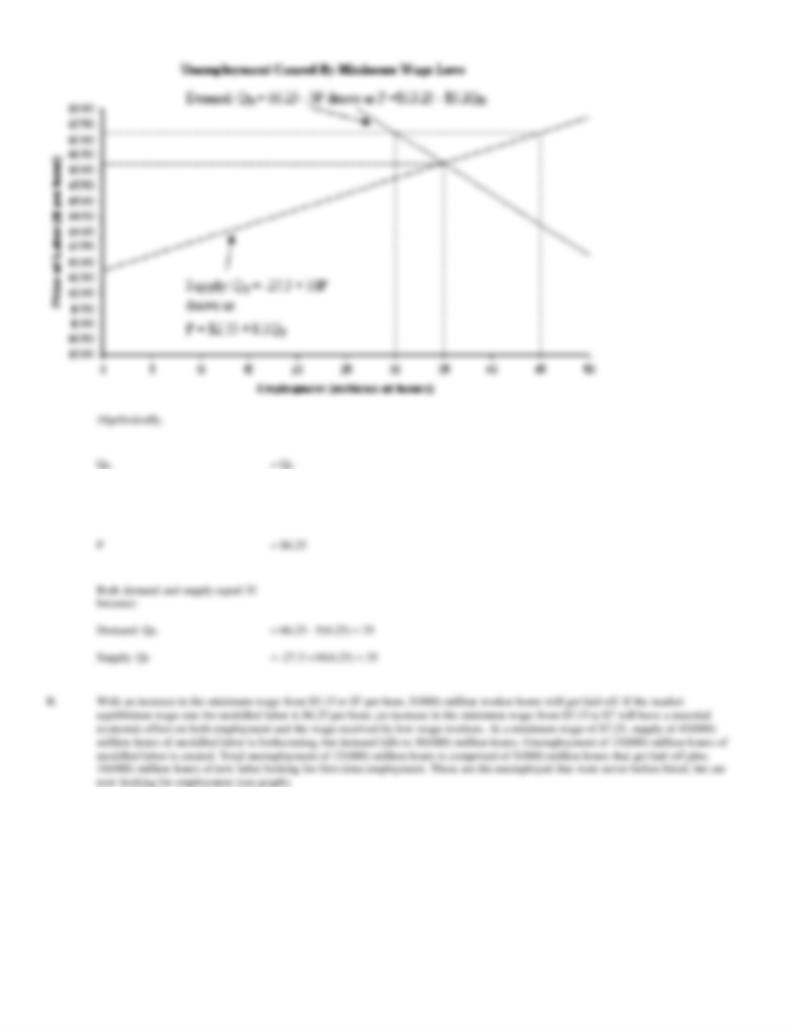
A.
Graph the ticket demand and supply curves using the price of tickets as a function of quantity (Q). On this same graph, draw another
ticket supply curve based upon the assumption that a local municipality imposes a $5 tax on each ticket sold to pay for police protection
and clean-up costs.
B.
Calculate the ticket price and quantity effects of the municipal tax. With perfectly elastic demand, who pays the economic burden of
such a tax?

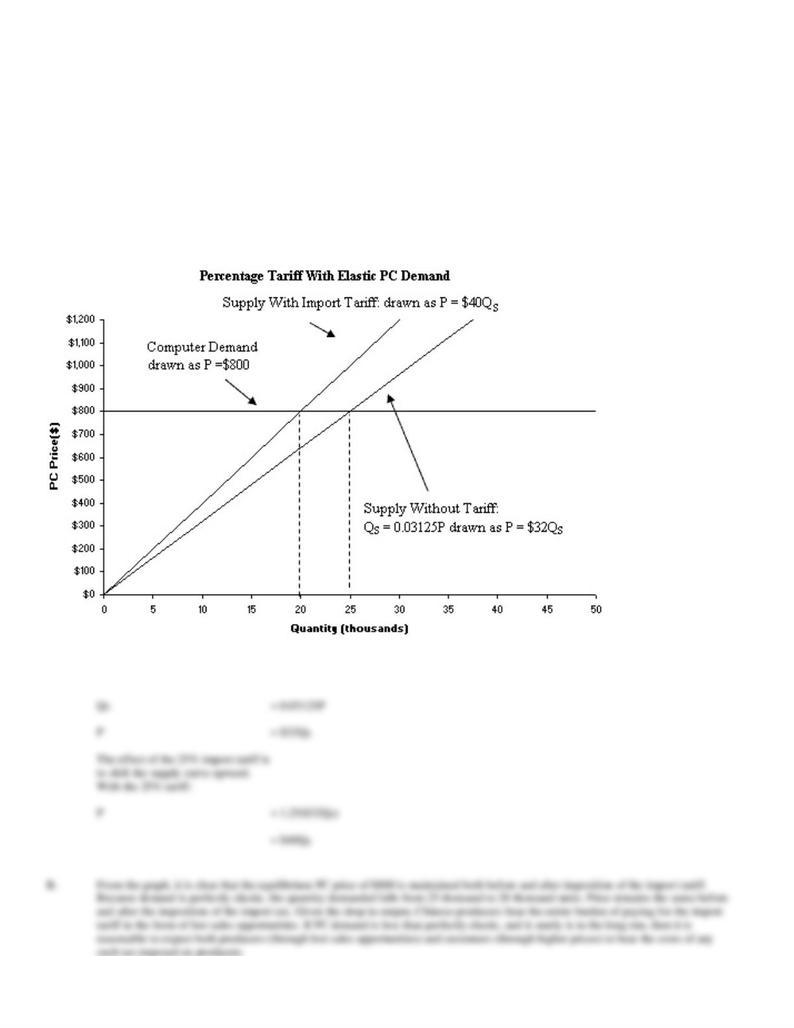
32. Percentage Tariff and Elastic Demand. Assume that the supply of imported personal computers (PCs)
from China is given by the expression:
QS
= 0.03125P
(Supply)
where Q is the number of PCs sold (in thousands) and P is the PC price. Given the availability of PCs on the Internet, assume that the demand for
PCs is perfectly elastic at a price of $800. This means that the PC demand curve can be drawn as a horizontal line that passes through $800 on the
Y-axis.
A.
Graph the PC demand and supply curves using price as a function of quantity (Q). On this same graph, draw another supply curve based
upon the assumption imports form China are subject to an 25% import tariff (tax) that is not imposed on imports from other countries.
B.
Calculate the PC price and quantity effects of the 25% import tariff. With perfectly elastic demand, who pays the economic burden of
such a tax?
33. Sales Tax and Elastic Demand. Assume that the supply of a best-selling book at local book stores
throughout the United States is a function price such that:
QS
= -50 + 5P
(Supply)
where Q is the number of books sold (in thousands) and P is the book price. Given the availability of this book on amazon.com for $20, demand is
perfectly elastic at a price of $20.
A.
Derive the book supply curve where price is expressed as a function of output. Calculate the equilibrium level of output and local
bookstore sales revenue.
B.
Derive a second book supply curve based upon the assumption local sales are subject to an 8% sales tax that is not imposed on Internet
sales. Calculate the book price and quantity effects of the local 8% sales tax. With perfectly elastic demand, who pays the economic
burden of such a tax?

34. Recycling Fee and Elastic Demand. Assume that the weekly supply of 16-ounce bottles of soda at
convenience stores in the Twin Cities of Minneapolis and St. Paul is a function of price such that:
QS
= -20 + 80P
(Supply)
where Q is the number of sodas sold in convenience stores (in thousands) and P is the soda price. Assume demand is perfectly elastic at a price of $1.
A.
Derive the soda supply curve where price is expressed as a function of output. Calculate the equilibrium level of output and
convenience store sales revenue.
B.
Derive a second curve based upon the assumption convenience store sales become subject to a 5 cent recycling fee. Calculate the price
and quantity effects of the recycling fee. With perfectly elastic demand, who pays the economic burden of such a fee.
35. Franchise Tax and Inelastic Demand. Assume the supply of broadband services in the City of
Williamsburg can be described as:
QS
= 1P
(Supply)
where Q is thousands of homes served per month with broadband service, and P is the price per month. Also assume that broadband service demand
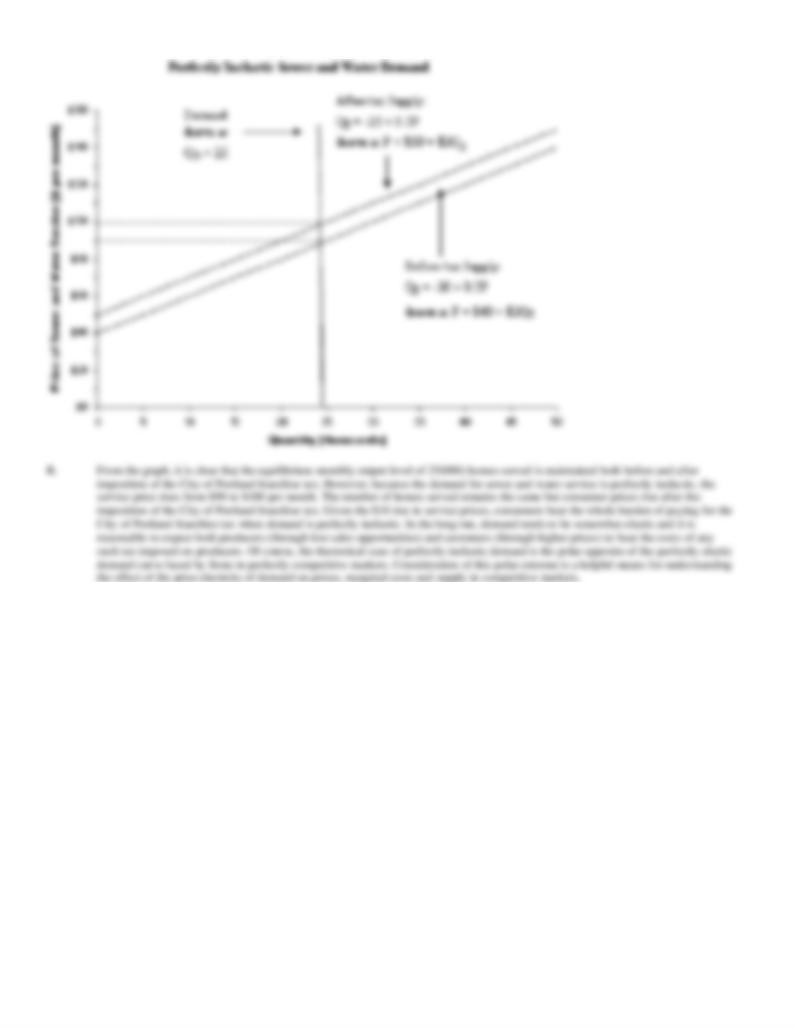
36. Franchise Tax and Inelastic Demand. Assume the supply of sewer and water services in the City of
Portland can be described as:
QS
= -20 + 0.5P
(Supply)
where Q is thousands of homes served per month with sewer and water service, and P is the price per month. Also assume that sewer and water
37. Franchise Tax and Inelastic Demand. Assume the supply of sewer and water services in the City of
Greenville, North Carolina, can be described as:
QS
= -150 + 2P
(Supply)
where Q is thousands of homes served per month with sewer and water service, and P is the price per month. Also assume that sewer and water
service demand is perfectly inelastic at a quantity of 50(000).
A.
Derive the sewer and water service supply curve where price is expressed as a function of output. Calculate the equilibrium level of
output and sewer and water utility sales revenue.
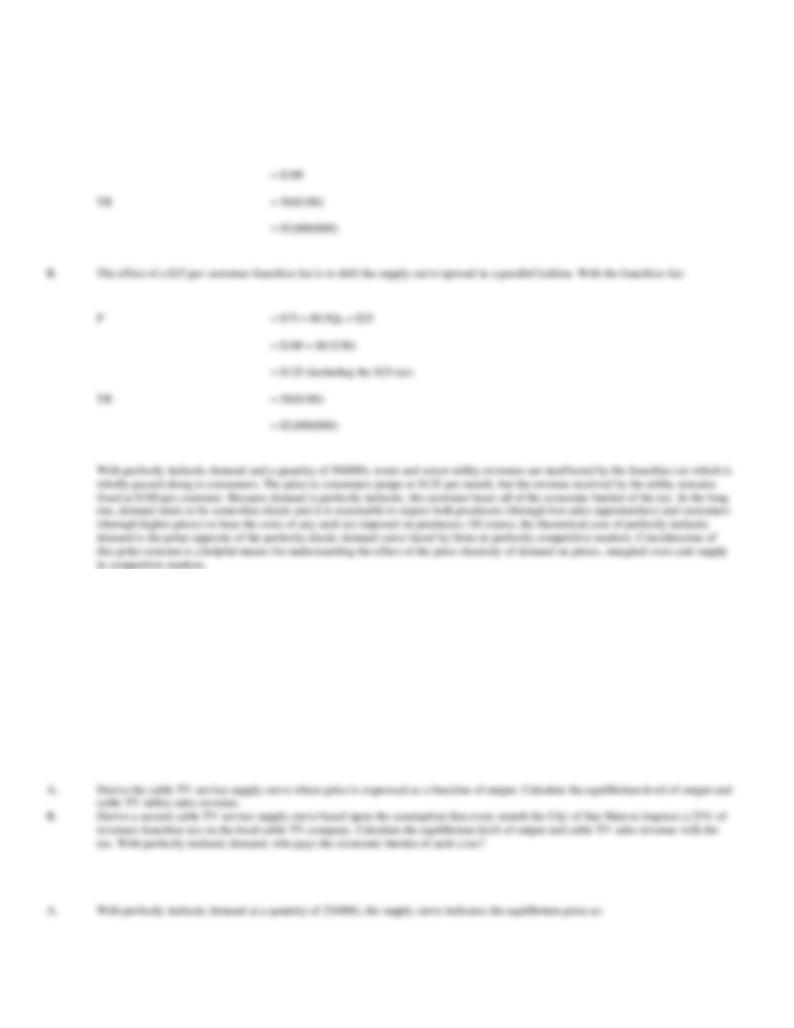
B.
Derive a second sewer and water service supply curve based upon the assumption that every month the City of Greenville imposes a
$25 per customer franchise tax. Calculate the equilibrium level of output and sewer and water utility sales revenue with the tax. With
perfectly inelastic demand, who pays the economic burden of such a tax?
38. Percentage Tax and Inelastic Demand. Assume the supply of cable TV services in the City of San
Marcos, Texas, can be described as:
QS
= -5 + 0.5P
(Supply)
where Q is thousands of homes served per month with cable TV service, and P is the price per month. Also assume that cable TV service demand is
perfectly inelastic at a quantity of 25(000).
A.
Derive the cable TV service supply curve where price is expressed as a function of output. Calculate the equilibrium level of output and
cable TV utility sales revenue.
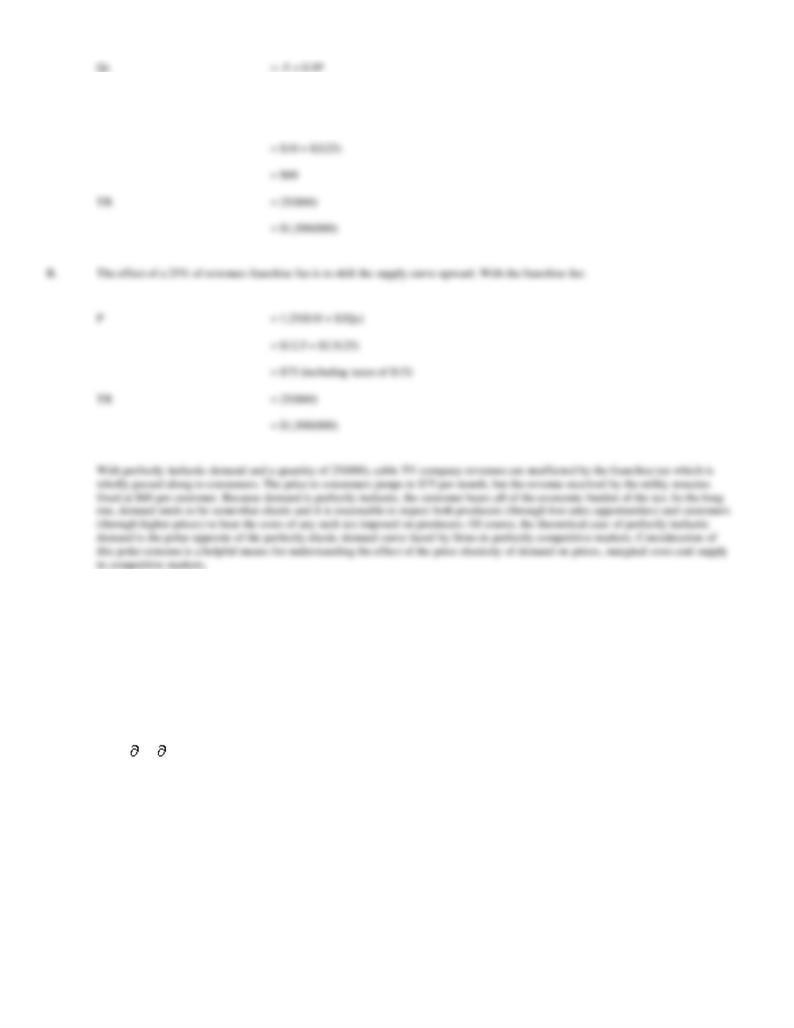
B.
Derive a second cable TV service supply curve based upon the assumption that every month the City of San Marcos imposes a 25% of
revenues franchise tax on the local cable TV company. Calculate the equilibrium level of output and cable TV sales revenue with the
tax. With perfectly inelastic demand, who pays the economic burden of such a tax?
39. Regulation Costs. Kingston Components, Inc., produces electronic components for cable TV systems.
Given vigorous import competition, prices are stable at $4,500 per unit in this dynamic and very competitive
market. Kingston's annual total cost (TC) and marginal cost (MC) relations are:
TC = $7,000,000 + $500Q + $0.5Q2
MC = TC/ Q = $500 + $1Q
where Q is output.
40. Compulsory Benefit Costs. Columbia Federal Savings & Loan, Inc. offers low-cost home mortgage
refinancing services on the Internet. Each refinancing brings the company $250 in fees, and these fees are stable
given the competitive nature of Internet marketing. Columbia's relies upon independent contractors (sales
associates) who work on a commission-only basis. Weekly total cost (TC) and marginal cost (MC) relations are:
TC = $200,000 + $50Q + $0.05Q2
MC = TC/ Q = $50 + $0.1Q
where Q is thousands of refinancing applications processed.
41. Compulsory Benefit Costs. The Telemarketing Louisianan Company generates leads for a major credit
card company using over-the-phone solicitations. Each lead generated brings TLC $10 in fees, and these fees
are stable given the competitive nature of the telemarketing business. TLC's relies upon independent contractors
(sales associates) who work on a commission-only basis. Weekly total cost (TC) and marginal cost (MC)
relations are:
TC = $50,000 + $0.0005Q2
MC = TC/ Q = $0.001Q
where Q is thousands of refinancing applications processed.
42. Tariffs. The Manchester Shoe Corporation is an importer and distributor of foreign-made footwear that is
sold at popular prices in leading discount retailers. The U.S. Commerce Department recently informed the
company that it will be subject to a new 25% tariff on the import cost of rubberized footwear originating from
China. The company is concerned that the tariff will slow its sales growth, given the highly competitive nature
of the footwear market where wholesale prices are stable at $5 per unit. Relevant total cost (TC) and marginal
cost (MC) relations for this product are:
TC = $100,000 + $0.00005Q2
MC = TC/ Q = $0.0001Q
A.
Calculate the optimal price/output combination and economic profit prior to imposition of the tariff.
B.
Calculate the optimal price/output combination and economic profit after imposition of the tariff.
C.
Compare your answers to Parts A and B. Who pays the economic burden of the import tariff?
43. Outsourcing Tariffs. The Seattle Software Company develops, manufactures, licenses, and supports a wide
range of software products. Its software products include operating systems for servers, personal computers
(PC), and intelligent devices; and server applications for distributed computing environments. To cut costs, the
company has begun to outsource to various Asian markets a significant amount of code checking and software
verification. The global code checking and software verification service market is fiercely price competitive
with prices stable at $25 per hour for services provided by trained and experienced software engineers. Relevant
total cost (TC) and marginal cost (MC) relations for a typical foreign supplier of code checking and software
verification services (Q) are:
TC = $1,500,000 + $0.00005Q2
MC = TC/ Q = $0.0001Q
44. Price Floors and Consumer Surplus. The U. S. wheat crop averages about 2 billion bushels per year, and
45. Price Floors and Producer Surplus. The U. S. wheat crop averages about 2 billion bushels per year, and is
46. Regulation Costs. Finlandia, Inc., manufacturers molded plastic products used to improve industrial
productivity. Suppose the Occupation Health and Safety Administration (OSHA) has required the firm to
enhance the durability of its popular safety helmet at a cost of $10 per unit. Prior to these costs, Finlandia's
annual manufacturing costs of this item are:
TC = $225,000 + $20Q + $0.001Q2
MC = ¶TC/ ¶Q = $20 + $0.002Q

where Q is units produced per year and TC includes a normal rate of return on investment.
47. Regulation Costs. Ottawa Construction, Ltd., is a medium-sized housing contractor located in eastern
Ontario. The company is adversely affected by new local regulations requiring it to pay $10,000 to cover sewer
and water hook-up charges for each new apartment Ottawa builds. Before such expenses, Ottawa's construction
costs are described as:
TC = $100,000 + $50,000Q + $2,500Q2
MC = ¶TC/ ¶Q = $50,000 + $5,000Q
where Q is the number of apartment units built per year and TC includes a normal rate of return on investment.
A.
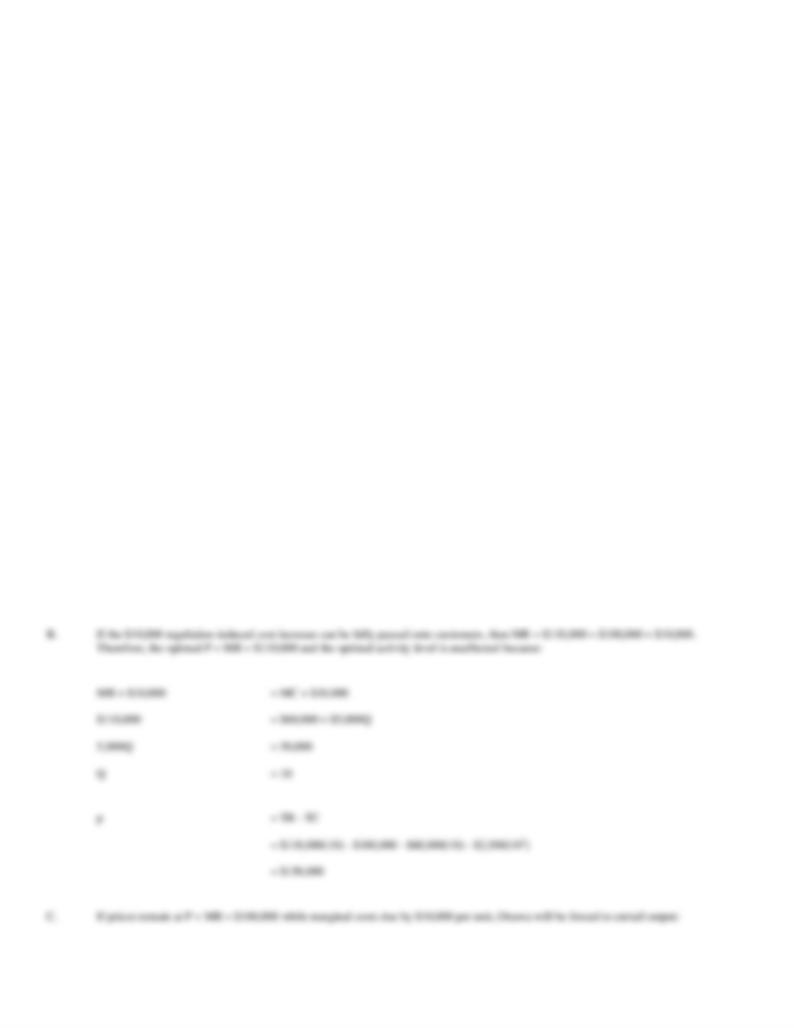
Calculate Ottawa's profit at the profit-maximizing activity level if prices in the industry are stable at $100,000 per unit, and therefore
P = MR = $100,000.
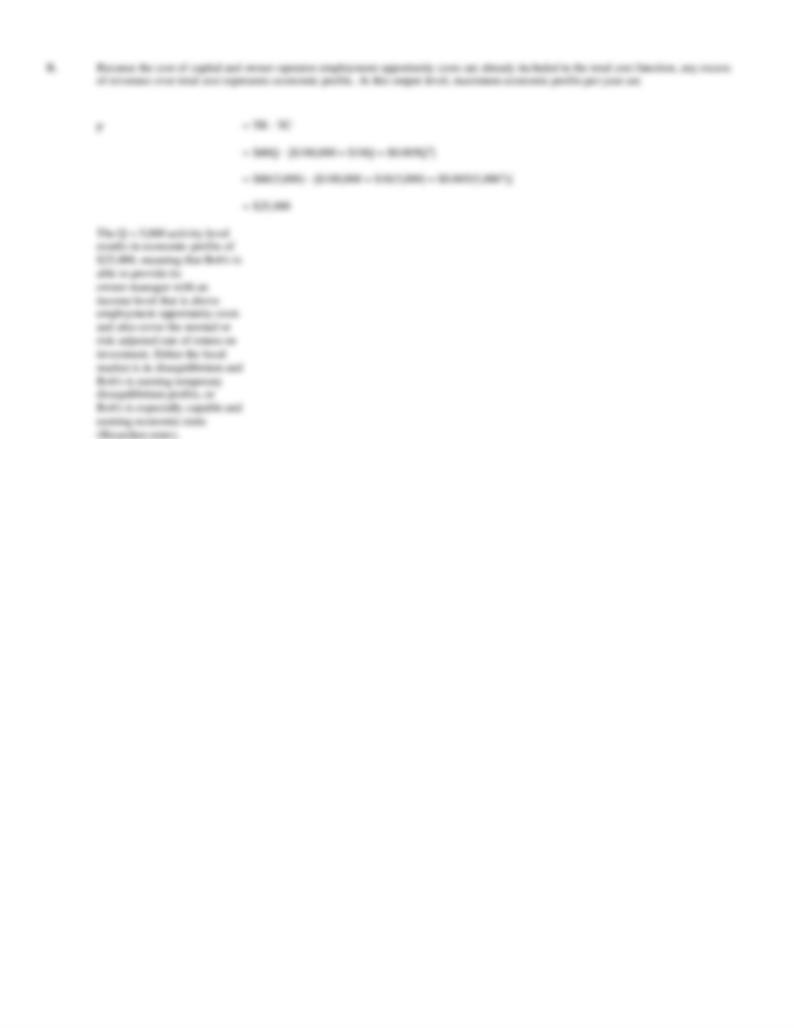
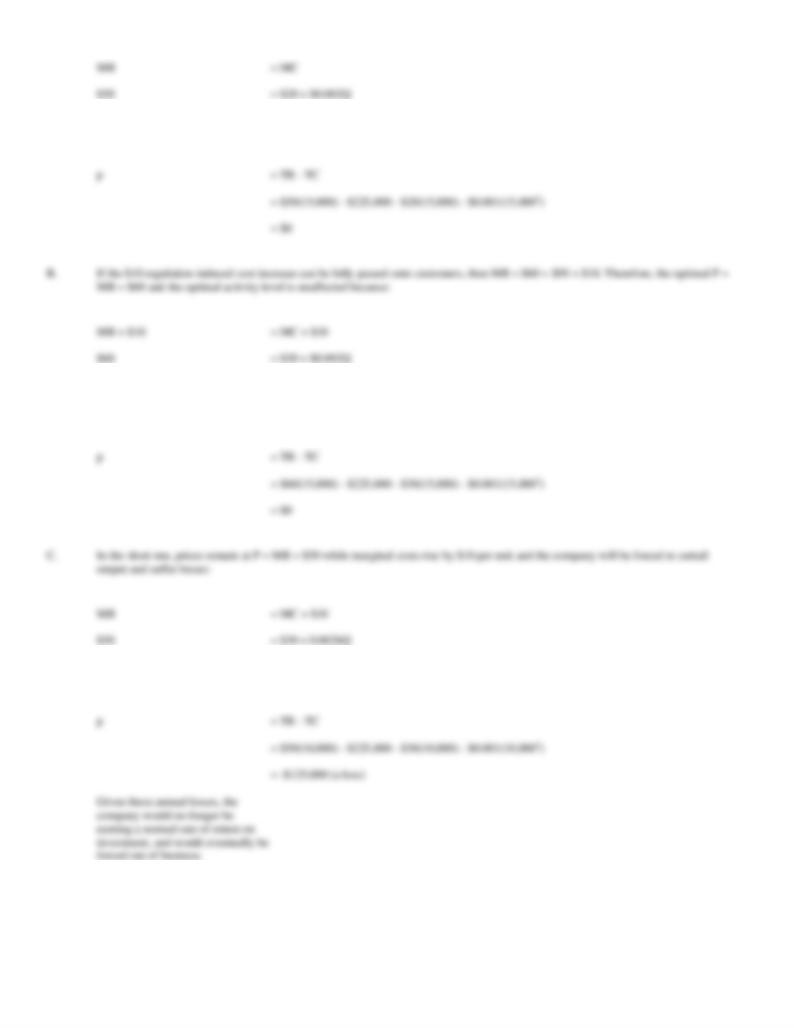
B.
Calculate Ottawa's optimal price, output, and profit levels if the new regulation-induced cost increase can be fully passed onto
customers.
C.
Determine the effect on output and profit if Ottawa is not able to pass onto consumers any of the projected cost increase.

48. Costs of Regulation. The Appalachian Coal Company sells coal to electric utilities in the southeast.
Unfortunately, Appalachian's coal has high particulate content and, therefore, the company is adversely affected
by state and local regulations governing smoke and dust emissions at its customer's electricity-generating plants.
Appalachian's total cost and marginal cost relations are:
TC = $250,000 + $5Q + $0.0002Q2
MC = ¶TC/ ¶Q = $5 + $0.0004Q
where Q is tons of coal produced per month and TC includes a normal rate of return on investment.
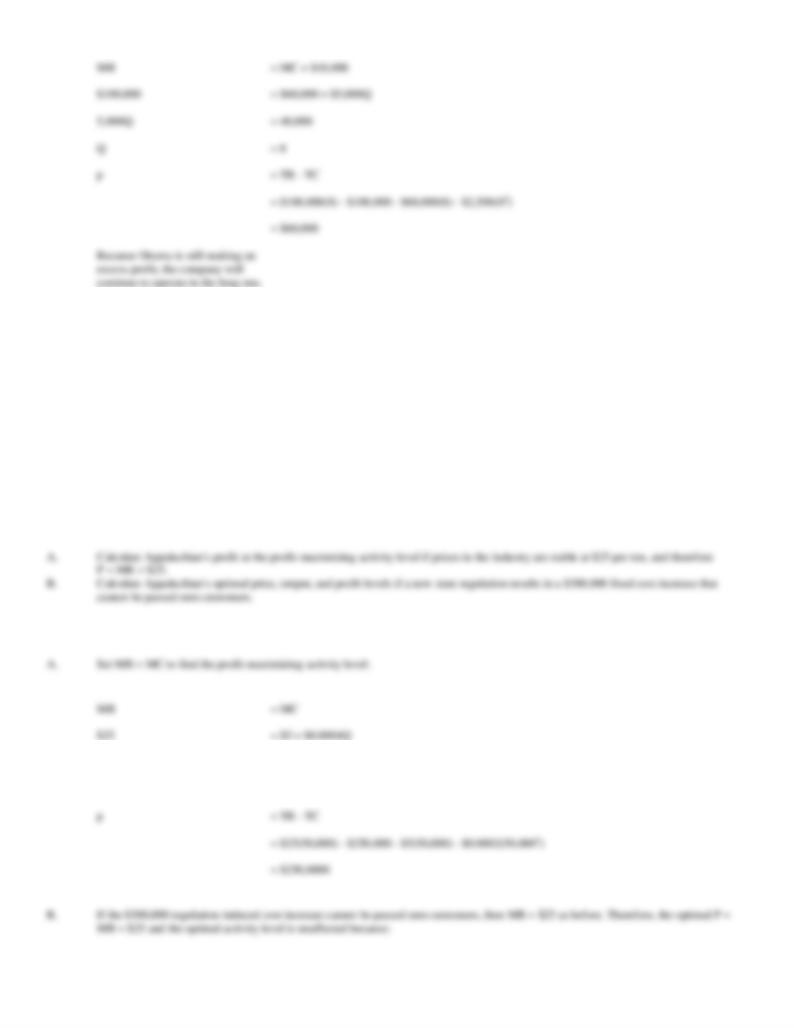
A.
Calculate Appalachian's profit at the profit-maximizing activity level if prices in the industry are stable at $25 per ton, and therefore
P = MR = $25.
B.
Calculate Appalachian's optimal price, output, and profit levels if a new state regulation results in a $300,000 fixed cost increase that
cannot be passed onto customers.
49. Competitive Strategy. Carry Underwood runs Tax Preparation Services, Inc., a small firm that offers
timely tax preparation services in Oklahoma City. Given the large number of competitors, the fact that tax
preparers rely heavily upon standard tax-preparation software, and the lack of entry barriers, it is reasonable to
assume that the tax form preparation market is perfectly competitive and that the average $150 price equals
marginal revenue, P = MR = $150. Assume that TPS's annual operating expenses are typical of several such
firms operating in the local market, and can be expressed by the following total and marginal cost functions:
TC = $830,000 + $10Q + $0.005Q2
MC = $10 + $0.01Q
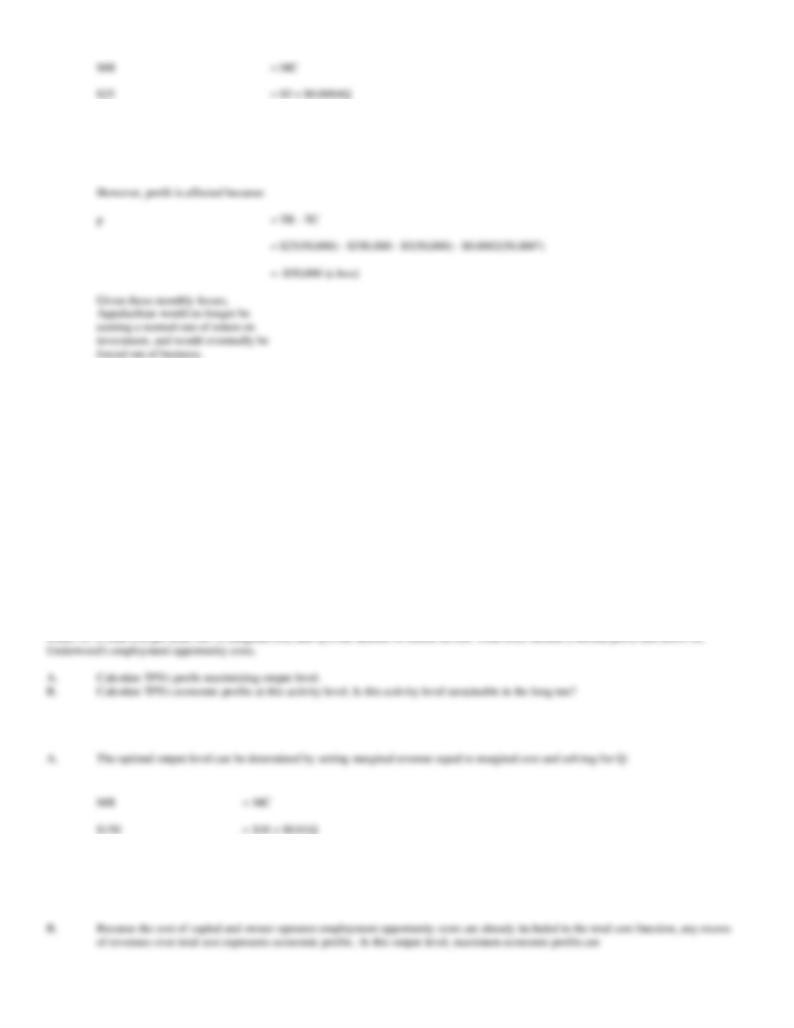
where TC is total cost per year, MC is marginal cost, and Q is the number of clients served. Total costs include a normal profit and allow for
Underwood's employment opportunity costs.
A.
Calculate TPS's profit-maximizing output level.
B.
Calculate TPS's economic profits at this activity level. Is this activity level sustainable in the long run?

50. Competitive Strategy. Bob Ice owns and operates Bob's Music Center, Ltd., a small firm that offers music
lessons in Huntsville, Alabama. Given the large number of competitors and the lack of entry barriers, it is
reasonable to assume that the market for music lessons is perfectly competitive and that the average $60 per
hour price equals marginal revenue, P = MR = $60. Assume that Bob's annual operating expenses are typical of
several such firms and individuals operating in the local market, and can be expressed by the following total and
marginal cost functions:
TC = $100,000 + $10Q + $0.005Q2
MC = $10 + $0.01Q
where TC is total cost per year, MC is marginal cost, and Q is the number lessons given. Total costs include a normal profit and allow for Bob's
employment opportunity costs.
A.
Calculate Bob's profit-maximizing output level.
B.
Calculate Bob's economic profits at this activity level. Is this activity level sustainable in the long run?
CHAPTER 11--PERFORMANCE AND STRATEGY IN
COMPETITIVE MARKETS Key
24. Economic rents are profits due to:
A. luck.
B. uniquely productive inputs
C. monopoly power.
D. regulation.
25. Above-normal returns earned in the time interval that exists between when a favorable influence on industry
demand or cost conditions first transpires and the time when competitor entry or growth finally develops are
called:
A. disequilibrium profits.
B. a normal rate of return on investment.
C. disequilibrium losses.
D. economic rents.
why.
A.
Producer surplus tends to fall as the supply curve becomes more elastic.
B.
Consumer surplus tends to rise as demand becomes more elastic.
C.
The market demand curve indicates the minimum price buyers are willing to pay at each level of production.
D.
The market supply curve indicates the minimum price required by sellers as a group to bring forth production.
E.
Consumer surplus is the amount that consumers are willing to pay for a given good or service above and beyond the amount actually
paid.
A.
True. Whereas consumer surplus is closely related to the demand curve for a product, producer surplus is closely related to the supply
curve for a product. It measures the amount by which the total revenues exceeds the marginal costs of production. As the supply curve
27. Competitive Market Equilibrium. Suppose demand and supply conditions in the competitive market for
unskilled labor are as follows:
QD
= 66.25 - 5P
(Demand)
QS
= -27.5 + 10P
(Supply)
where Q is millions of hours of unskilled labor and P is the wage rate per hour.
A.
Calculate the industry equilibrium wage/employment combination.
B.
Confirm your answer graphically.
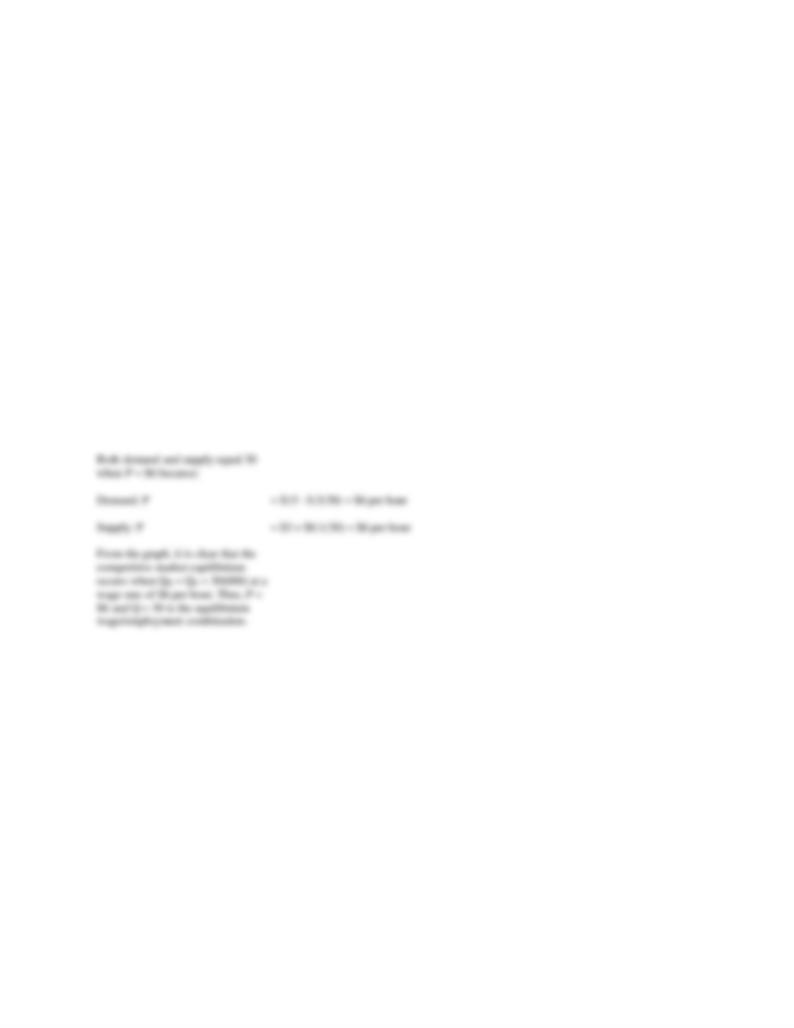
A.
Algebraically,
QD
= QS
66.25 - 5P
= -27.5 +10P
15P
= 93.75
28. Competitive Market Equilibrium. Assume demand and supply conditions in the competitive market for
unskilled labor are as follows:
P
= $15 - 0.3QD
(Demand)
P
= $0.2QS
(Supply)
where Q is millions of hours of unskilled labor and P is the wage rate per hour.
0.5Q
= 15
Q
= 30
29. Competitive Market Surplus. Suppose demand and supply conditions in the competitive market for
unskilled labor are as follows:
P
= $15 - 0.3QD
(Demand)
P
= $3 + $0.1QS
(Supply)
where Q is millions of hours of unskilled labor and P is the wage rate per hour.
A.
Illustrate the industry equilibrium wage/employment combination both graphically and algebraically.
B.
Calculate the level of excess supply (unemployment) if the Federal minimum wage is raised from $5.15 to $7 per hour.
A.
Algebraically,
P
= P
$15 - 0.3Q
= $3 + $0.1Q
0.4Q
= 12
Q
= 30
30. Competitive Market Surplus. Assume demand and supply conditions in the competitive market for
unskilled labor are as follows:
QD
= 66.25 - 5P
(Demand)
QS
= -27.5 + 10P
(Supply)
where Q is millions of hours of unskilled labor and P is the wage rate per hour.
66.25 - 5P
= -27.5 +10P
15P
= 93.75
31. Per Unit Tax and Elastic Demand. Assume that the supply of tickets to an outdoor music festival in
Thousand Oaks, California, is a function of price such that:
QS
= 1P
(Supply)
where Q is the number of tickets (in thousands) and P is the ticket price. Also assume that the demand for such concert tickets is perfectly elastic at a
price of $30. This means that the ticket demand curve can be drawn as a horizontal line that passes through $30 on the Y-axis.
A.
Graph the ticket demand and supply curves using the price of tickets as a function of quantity (Q). On this same graph, draw another
ticket supply curve based upon the assumption that a local municipality imposes a $5 tax on each ticket sold to pay for police protection
32. Percentage Tariff and Elastic Demand. Assume that the supply of imported personal computers (PCs)
from China is given by the expression:
QS
= 0.03125P
(Supply)
where Q is the number of PCs sold (in thousands) and P is the PC price. Given the availability of PCs on the Internet, assume that the demand for
PCs is perfectly elastic at a price of $800. This means that the PC demand curve can be drawn as a horizontal line that passes through $800 on the
Y-axis.
A.
Graph the PC demand and supply curves using price as a function of quantity (Q). On this same graph, draw another supply curve based
upon the assumption imports form China are subject to an 25% import tariff (tax) that is not imposed on imports from other countries.
B.
Calculate the PC price and quantity effects of the 25% import tariff. With perfectly elastic demand, who pays the economic burden of
such a tax?
A.
From the supply curve,
33. Sales Tax and Elastic Demand. Assume that the supply of a best-selling book at local book stores
throughout the United States is a function price such that:
QS
= -50 + 5P
(Supply)
where Q is the number of books sold (in thousands) and P is the book price. Given the availability of this book on amazon.com for $20, demand is
perfectly elastic at a price of $20.
A.
Derive the book supply curve where price is expressed as a function of output. Calculate the equilibrium level of output and local
bookstore sales revenue.
B.
Derive a second book supply curve based upon the assumption local sales are subject to an 8% sales tax that is not imposed on Internet
sales. Calculate the book price and quantity effects of the local 8% sales tax. With perfectly elastic demand, who pays the economic
burden of such a tax?
A.
With perfectly elastic demand at a price of $20, the supply curve indicates the equilibrium level of output as:
QS
= -50 + 5P
0.216QS
= -10.8 + P
QS
= -50 + 4.63P
34. Recycling Fee and Elastic Demand. Assume that the weekly supply of 16-ounce bottles of soda at
convenience stores in the Twin Cities of Minneapolis and St. Paul is a function of price such that:
QS
= -20 + 80P
(Supply)
where Q is the number of sodas sold in convenience stores (in thousands) and P is the soda price. Assume demand is perfectly elastic at a price of $1.
A.
Derive the soda supply curve where price is expressed as a function of output. Calculate the equilibrium level of output and
convenience store sales revenue.
B.
Derive a second curve based upon the assumption convenience store sales become subject to a 5 cent recycling fee. Calculate the price
and quantity effects of the recycling fee. With perfectly elastic demand, who pays the economic burden of such a fee.
A.
With perfectly elastic demand at a price of $1, the supply curve indicates the equilibrium level of output as:
QS
= -20 + 80P
= -20 + 80(1)
= 60(000)
0.0125QS
= -0.3 + P
QS
= -24 + 80P
35. Franchise Tax and Inelastic Demand. Assume the supply of broadband services in the City of
Williamsburg can be described as:
QS
= 1P
(Supply)
where Q is thousands of homes served per month with broadband service, and P is the price per month. Also assume that broadband service demand
is perfectly inelastic at a quantity of 30(000). This means that the broadband demand curve can be drawn as a vertical line that passes through
30(000) on the X-axis.
A.
Graph the broadband demand and supply curves using price as a function of the quantity of service demanded (Q). On this same graph,
draw another supply curve based upon the assumption that the City of Williamsburg imposes a franchise tax that increases provider
costs by $5 per customer every month.

36. Franchise Tax and Inelastic Demand. Assume the supply of sewer and water services in the City of
Portland can be described as:
QS
= -20 + 0.5P
(Supply)
where Q is thousands of homes served per month with sewer and water service, and P is the price per month. Also assume that sewer and water
service demand is perfectly inelastic at a quantity of 25(000). This means that the sewer and water demand curve can be drawn as a vertical line that
passes through 25(000) on the X-axis.
0.5P
= 20 + QS
P
= $40 + $2QS
37. Franchise Tax and Inelastic Demand. Assume the supply of sewer and water services in the City of
Greenville, North Carolina, can be described as:
QS
= -150 + 2P
(Supply)
where Q is thousands of homes served per month with sewer and water service, and P is the price per month. Also assume that sewer and water
service demand is perfectly inelastic at a quantity of 50(000).
A.
Derive the sewer and water service supply curve where price is expressed as a function of output. Calculate the equilibrium level of
output and sewer and water utility sales revenue.
B.
Derive a second sewer and water service supply curve based upon the assumption that every month the City of Greenville imposes a
$25 per customer franchise tax. Calculate the equilibrium level of output and sewer and water utility sales revenue with the tax. With
perfectly inelastic demand, who pays the economic burden of such a tax?
A.
With perfectly inelastic demand at a quantity of 50(000), the supply curve indicates the equilibrium price as:
QS
= -150 + 2P
2P
= 150 + QS
P
= $75 + $0.5QS
= $75 + $0.5(50)
38. Percentage Tax and Inelastic Demand. Assume the supply of cable TV services in the City of San
Marcos, Texas, can be described as:
QS
= -5 + 0.5P
(Supply)
where Q is thousands of homes served per month with cable TV service, and P is the price per month. Also assume that cable TV service demand is
perfectly inelastic at a quantity of 25(000).
0.5P
= 5 + QS
P
= $10 + $2QS
39. Regulation Costs. Kingston Components, Inc., produces electronic components for cable TV systems.
Given vigorous import competition, prices are stable at $4,500 per unit in this dynamic and very competitive
market. Kingston's annual total cost (TC) and marginal cost (MC) relations are:
TC = $7,000,000 + $500Q + $0.5Q2
MC = TC/ Q = $500 + $1Q
where Q is output.
Suppose the Occupational Health and Safety Administration (OSHA) has recently ruled that the company must install expensive new shielding
equipment to guard against worker injuries. This will increase the marginal cost of manufacturing by $100 per unit. Kingston's fixed expenses, which
include a required return on investment, will be unaffected.
A.
Calculate Kingston's profit-maximizing price/output combination and economic profits before installation of the OSHA-mandated
shielding equipment.
B.
Calculate the profit-maximizing price/output combination and economic profits after Kingston has met OSHA guidelines.
C.
Compare your answers to parts A and B. Who pays the economic burden of meeting OSHA guidelines?
A.
If prices are stable at $4,500 per unit, Kingston will maximize profits by setting MR = MC = $4,500. Before the OSHA-mandated
increase in costs:
MR
= MC
$4,500
= $500 + $1Q
Q
= 4,000
40. Compulsory Benefit Costs. Columbia Federal Savings & Loan, Inc. offers low-cost home mortgage
refinancing services on the Internet. Each refinancing brings the company $250 in fees, and these fees are stable
given the competitive nature of Internet marketing. Columbia's relies upon independent contractors (sales
associates) who work on a commission-only basis. Weekly total cost (TC) and marginal cost (MC) relations are:
TC = $200,000 + $50Q + $0.05Q2
MC = TC/ Q = $50 + $0.1Q
where Q is thousands of refinancing applications processed.
Suppose the US Department of Labor recently ruled that Columbia's sales associates must be considered employees entitled to benefits under the
Employee Retirement Income Security Act (ERISA). As a result, Columbia's marginal cost of doing business will rise by $25 per unit. Columbia's
fixed expenses, which include a required return on investment, will be unaffected.
A.
Calculate Columbia's profit-maximizing price/output combination and economic profits before meeting DOL guidelines.
B.
Calculate the profit-maximizing price/output combination and economic profits after Columbia has met DOL guidelines.
C.
Compare your answers to parts A and B. Who pays the economic burden of meeting DOL guidelines?
A.
If prices are stable at $250 per unit, Columbia will maximize profits by setting MR = MC = $250. Before the DOL-mandated increase
in costs:
MR
= MC
$250
= $50 + $0.1Q
Q
= 2,000
Economic Profits
= PQ - TC
41. Compulsory Benefit Costs. The Telemarketing Louisianan Company generates leads for a major credit
card company using over-the-phone solicitations. Each lead generated brings TLC $10 in fees, and these fees
are stable given the competitive nature of the telemarketing business. TLC's relies upon independent contractors
(sales associates) who work on a commission-only basis. Weekly total cost (TC) and marginal cost (MC)
relations are:
TC = $50,000 + $0.0005Q2
MC = TC/ Q = $0.001Q
where Q is thousands of refinancing applications processed.
Suppose the US Department of Labor recently ruled that TLC's sales associates must be considered employees entitled to benefits under the
Employee Retirement Income Security Act (ERISA). As a result, TLC's marginal cost of doing business will rise by $1 per unit. TLC's fixed
expenses, which include a required return on investment, will be unaffected.
A.
Calculate TLC's profit-maximizing price/output combination and economic profits before meeting DOL guidelines.
B.
Calculate the profit-maximizing price/output combination and economic profits after TLC has met DOL guidelines.
C.
Compare your answers to parts A and B. Who pays the economic burden of meeting DOL guidelines?
A.
If prices are stable at $10 per unit, TLC will maximize profits by setting MR = MC = $10. Before the DOL-mandated increase in costs:
MR
= MC
$10
= $0.001Q
Q
= 10,000
Economic Profits
= PQ - TC
= $10(10,000) - [$50,000 + $0.0005(10,0002)]
42. Tariffs. The Manchester Shoe Corporation is an importer and distributor of foreign-made footwear that is
sold at popular prices in leading discount retailers. The U.S. Commerce Department recently informed the
company that it will be subject to a new 25% tariff on the import cost of rubberized footwear originating from
China. The company is concerned that the tariff will slow its sales growth, given the highly competitive nature
of the footwear market where wholesale prices are stable at $5 per unit. Relevant total cost (TC) and marginal
cost (MC) relations for this product are:
TC = $100,000 + $0.00005Q2
MC = TC/ Q = $0.0001Q
A.
Calculate the optimal price/output combination and economic profit prior to imposition of the tariff.
B.
Calculate the optimal price/output combination and economic profit after imposition of the tariff.
C.
Compare your answers to Parts A and B. Who pays the economic burden of the import tariff?
A.
The company will maximize profits by setting MR = MC. Prior to imposition of the tariff, marginal cost reflects import costs plus
selling expenses only:
MR
= MC
$5
= $0.0001Q
Q
= 50,000
Economic Profits
= PQ - TC
= $5(50,000) - [$100,000 + 0.00005(50,0002)]
43. Outsourcing Tariffs. The Seattle Software Company develops, manufactures, licenses, and supports a wide
range of software products. Its software products include operating systems for servers, personal computers
(PC), and intelligent devices; and server applications for distributed computing environments. To cut costs, the
company has begun to outsource to various Asian markets a significant amount of code checking and software
verification. The global code checking and software verification service market is fiercely price competitive
with prices stable at $25 per hour for services provided by trained and experienced software engineers. Relevant
total cost (TC) and marginal cost (MC) relations for a typical foreign supplier of code checking and software
verification services (Q) are:
TC = $1,500,000 + $0.00005Q2
MC = TC/ Q = $0.0001Q
A.
Calculate the optimal price/output combination and economic profit for a typical foreign supplier prior to imposition of the tariff.
B.
Calculate the optimal price/output combination and economic profit for a typical foreign supplier after imposition of the tariff.
C.
Compare your answers to parts A and B. Who pays the economic burden of the import tariff?
A.
The typical supplier of code checking and software verification services will maximize profits by setting MR = MC. Prior to imposition
of the tariff, set:
MR
= MC
$25
= $0.0001Q
Q
= 250,000(000)
Economic Profits
= PQ - TC
= $25(250,000) - [$1,500,000 + $0.00005(250,0002)]
44. Price Floors and Consumer Surplus. The U. S. wheat crop averages about 2 billion bushels per year, and
is about 10 percent of the 20 billion-bushel foreign wheat crop. Typically, the market has a relatively good
estimate of the wheat crop from the United States and Canada, but wheat crops from the Southern Hemisphere
are much harder to predict. Argentina's wheat acreage varies dramatically from one year to another, for
example, and Australia has hard-to-predict rainfall in key wheat production areas. To illustrate some of the cost
in social welfare from agricultural price supports, assume the following market supply and demand conditions
for wheat:
P
= $2 + 0.001QS
(Market Supply)
P
= $4,80 - $0.0004QD
(Market Demand)
where Q is output in bushels of wheat (in millions), and P is the market price per bushel.
0.0014Q
= 2.8
Q
= 2,000 (million)
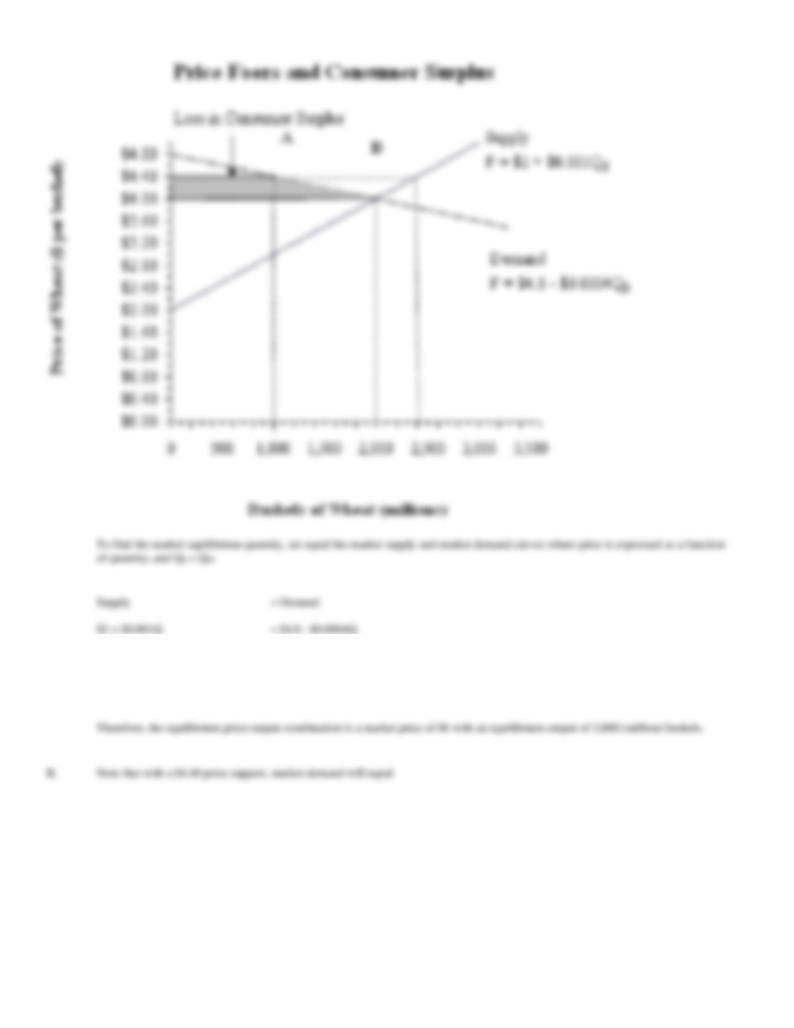
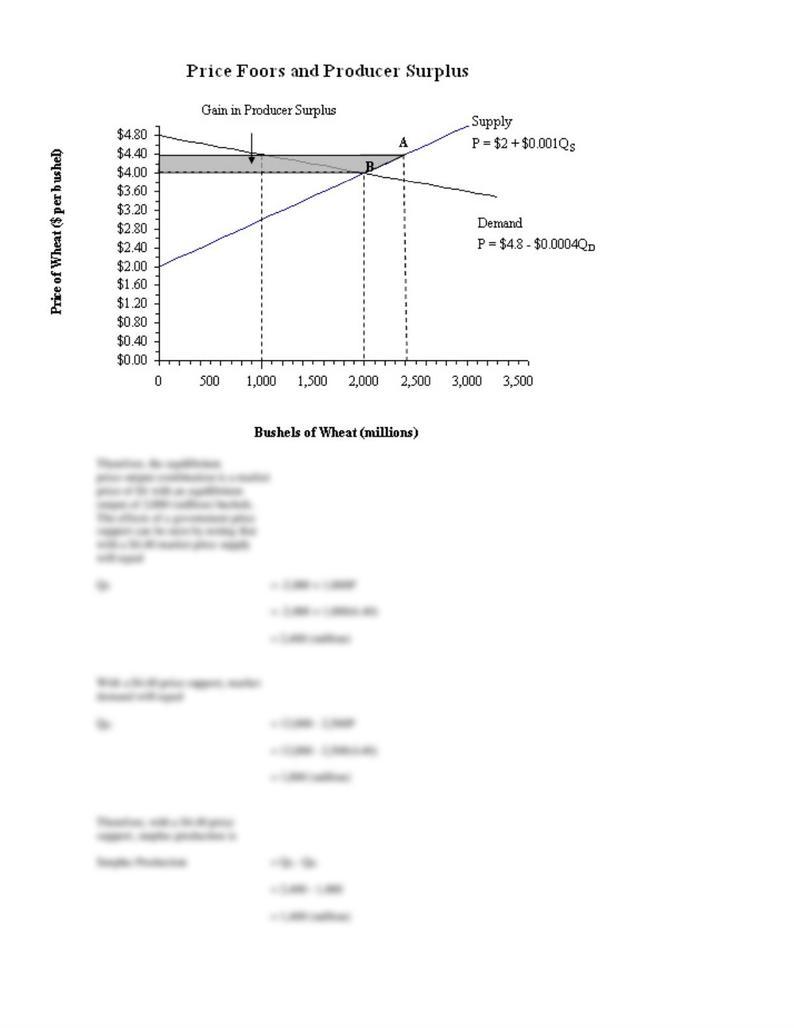
45. Price Floors and Producer Surplus. The U. S. wheat crop averages about 2 billion bushels per year, and is
about 10 percent of the 20 billion-bushel foreign wheat crop. Typically, the market has a relatively good
estimate of the wheat crop from the United States and Canada, but wheat crops from the Southern Hemisphere
are much harder to predict. Argentina's wheat acreage varies dramatically from one year to another, for
example, and Australia has hard-to-predict rainfall in key wheat production areas. To illustrate some of the cost
in social welfare from agricultural price supports, assume the following market supply and demand conditions
for wheat:
QS
= -2,000 + 1,000P
(Market Supply)
QD
= 12,000 - 2,500P
(Market Demand)
where Q is output in bushels of wheat (in millions), and P is the market price per bushel.
A.
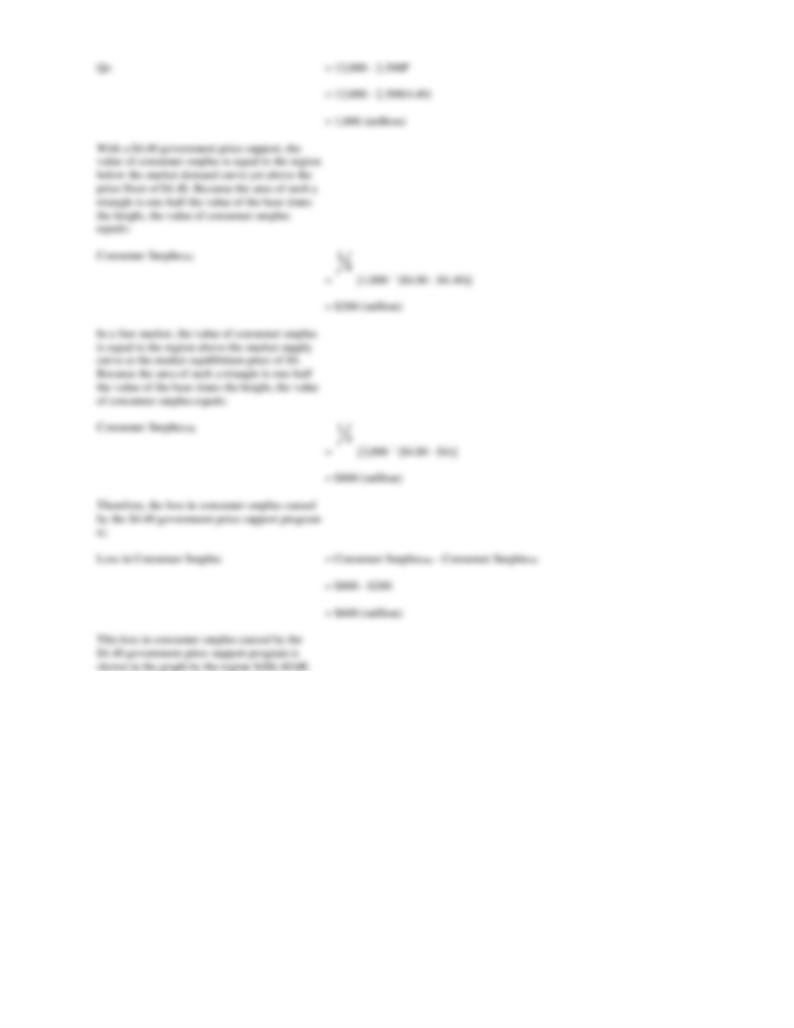
Graph and calculate the equilibrium price/output solution. Use this graph to help you algebraically determine the amount of surplus
production the government will be forced to buy if it imposes a support price of $4.40 per bushel.
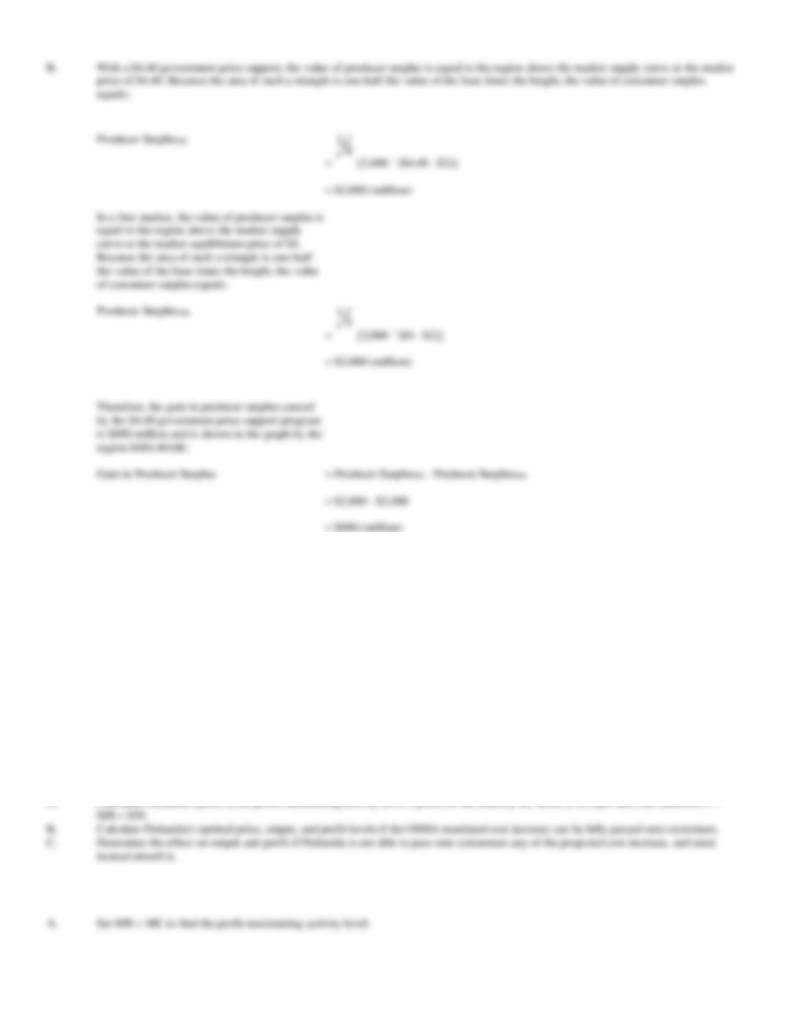
B.
Use this graph to help you algebraically determine the gain in producer surplus due to the price support program. Explain.
A.
The market supply curve is given by the equation
QS
= -2,000 + 1,000P
or, solving for price,
1,000P
= 2,000 + QS
P
= $2 + $0.001QS
The market demand curve is given
by the equation
QD
= 12,000 - 2,500P
0.0014Q
= 2.8
Q
= 2,000 (million)
46. Regulation Costs. Finlandia, Inc., manufacturers molded plastic products used to improve industrial
productivity. Suppose the Occupation Health and Safety Administration (OSHA) has required the firm to
enhance the durability of its popular safety helmet at a cost of $10 per unit. Prior to these costs, Finlandia's
annual manufacturing costs of this item are:
TC = $225,000 + $20Q + $0.001Q2
MC = ¶TC/ ¶Q = $20 + $0.002Q
where Q is units produced per year and TC includes a normal rate of return on investment.
0.002Q
= 30
Q
= 15,000
0.002Q
= 30
Q
= 15,000
0.002Q
= 20
Q
= 10,000
47. Regulation Costs. Ottawa Construction, Ltd., is a medium-sized housing contractor located in eastern
Ontario. The company is adversely affected by new local regulations requiring it to pay $10,000 to cover sewer
and water hook-up charges for each new apartment Ottawa builds. Before such expenses, Ottawa's construction
costs are described as:
TC = $100,000 + $50,000Q + $2,500Q2
MC = ¶TC/ ¶Q = $50,000 + $5,000Q
where Q is the number of apartment units built per year and TC includes a normal rate of return on investment.
A.
Calculate Ottawa's profit at the profit-maximizing activity level if prices in the industry are stable at $100,000 per unit, and therefore
P = MR = $100,000.
B.
Calculate Ottawa's optimal price, output, and profit levels if the new regulation-induced cost increase can be fully passed onto
customers.
C.
Determine the effect on output and profit if Ottawa is not able to pass onto consumers any of the projected cost increase.
A.
Set MR = MC to find the profit-maximizing activity level:
MR
= MC
$100,000
= $50,000 + $5,000Q
5,000Q
= 50,000
Q
= 10
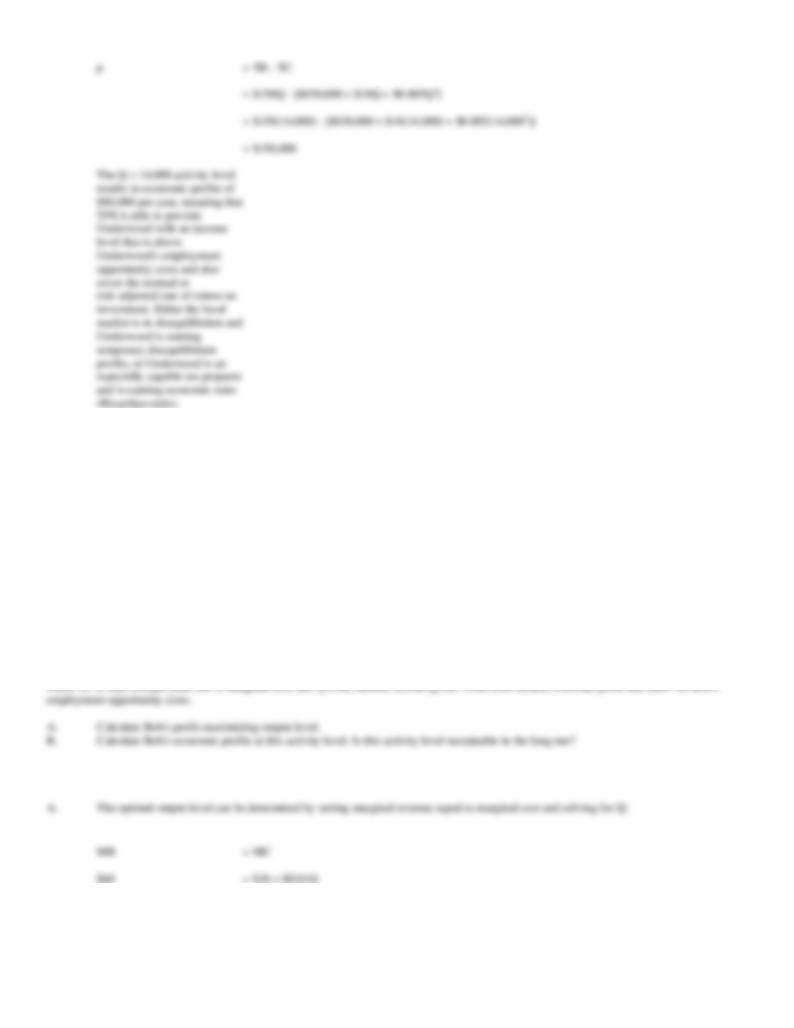
p
= TR - TC
= $100,000(10) - $100,000 - $50,000(10) - $2,500(102)
= $150,000
48. Costs of Regulation. The Appalachian Coal Company sells coal to electric utilities in the southeast.
Unfortunately, Appalachian's coal has high particulate content and, therefore, the company is adversely affected
by state and local regulations governing smoke and dust emissions at its customer's electricity-generating plants.
Appalachian's total cost and marginal cost relations are:
TC = $250,000 + $5Q + $0.0002Q2
MC = ¶TC/ ¶Q = $5 + $0.0004Q
where Q is tons of coal produced per month and TC includes a normal rate of return on investment.
0.0004Q
= 20
Q
= 50,000
0.0004Q
= 20
Q
= 50,000
49. Competitive Strategy. Carry Underwood runs Tax Preparation Services, Inc., a small firm that offers
timely tax preparation services in Oklahoma City. Given the large number of competitors, the fact that tax
preparers rely heavily upon standard tax-preparation software, and the lack of entry barriers, it is reasonable to
assume that the tax form preparation market is perfectly competitive and that the average $150 price equals
marginal revenue, P = MR = $150. Assume that TPS's annual operating expenses are typical of several such
firms operating in the local market, and can be expressed by the following total and marginal cost functions:
TC = $830,000 + $10Q + $0.005Q2
MC = $10 + $0.01Q
0.01Q
= 140
Q
= 14,000 tax forms per year
50. Competitive Strategy. Bob Ice owns and operates Bob's Music Center, Ltd., a small firm that offers music
lessons in Huntsville, Alabama. Given the large number of competitors and the lack of entry barriers, it is
reasonable to assume that the market for music lessons is perfectly competitive and that the average $60 per
hour price equals marginal revenue, P = MR = $60. Assume that Bob's annual operating expenses are typical of
several such firms and individuals operating in the local market, and can be expressed by the following total and
marginal cost functions:
TC = $100,000 + $10Q + $0.005Q2
MC = $10 + $0.01Q
0.01Q
= 50
Q
= 5,000 lessons per year