CHAPTER 2--ECONOMIC OPTIMIZATION
Student: ___________________________________________________________________________
1. An equation is:
A. an analytical expression of functional relationships.
B. a visual representation of data.
6. Which of the following short run strategies should a manager select to obtain the highest degree of sales


26. Marginal Analysis. Consider the price (P) and output (Q) data in the following table.
Q
P
TR
MR
AR
0
$35
1
30
2
25
3
20
4
15
5
10
6
5
7
0
A.
Calculate the related total revenue (TR), marginal revenue (MR), and average revenue (AR) figures.
B.
At what output level is revenue maximized?
27. Marginal Analysis. Evaluate the price (P) and the output (Q) data in the following table.
Q
P
TR
MR
AR
0
$80
1
70
2
60
3
50
4
40
5
30
6
20
7
10
8
0
A.
Compute the related total revenue (TR), marginal revenue (MR), and average revenue (AR) figures:
B.
At what output level is revenue maximized?
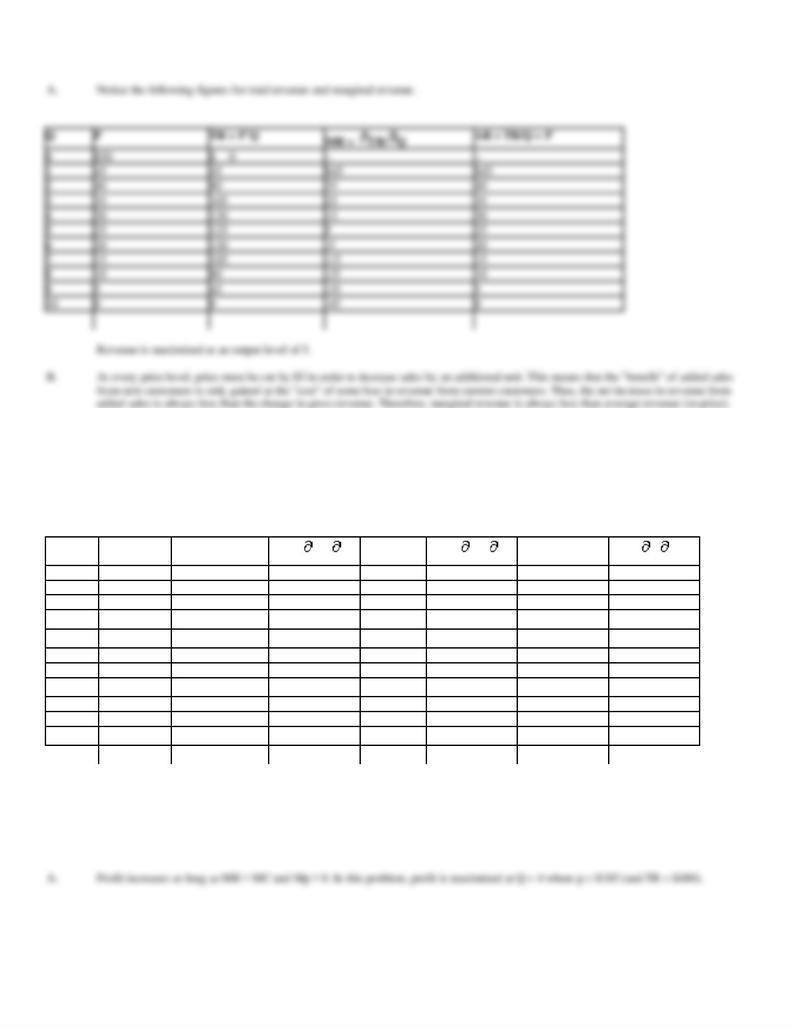
28. Revenue Maximization. Assume the following output (Q) and price (P) data.
Q
P
TR
MR
AR
0
$50
1
45
2
40
3
35
4
30
5
25
6
20
7
15
8
10
9
5
10
0
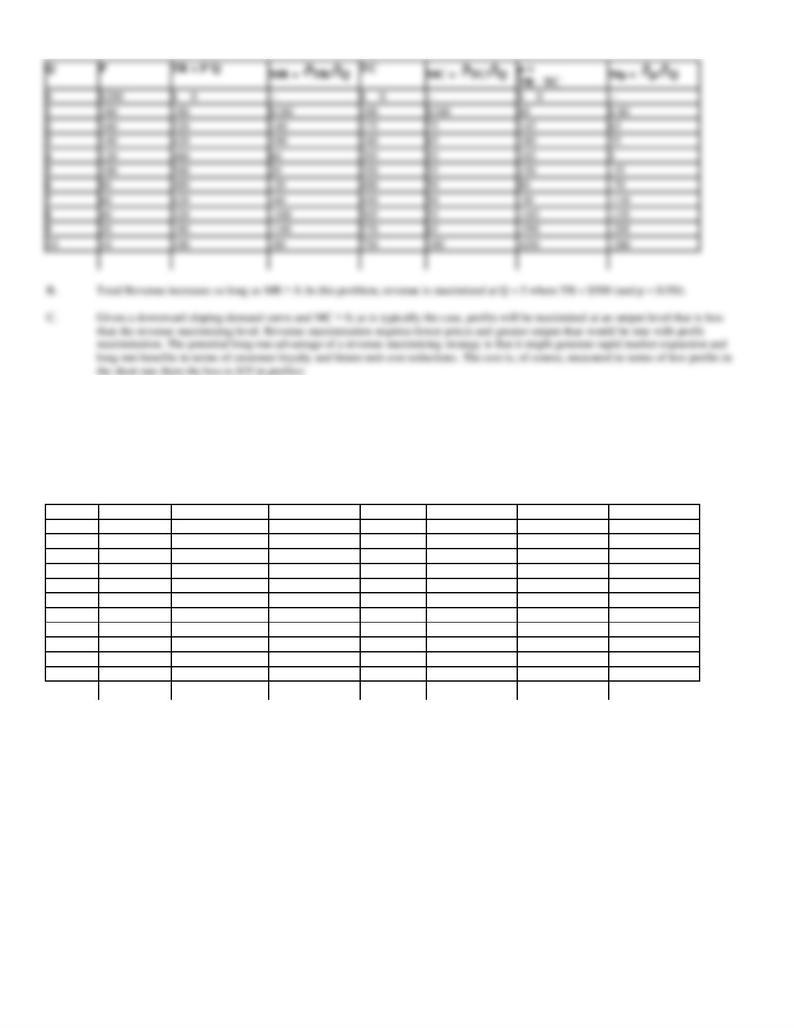
29. Profit Maximization. Fill in the missing data for price (P), total revenue (TR), marginal revenue (MR),
total cost (TC), marginal cost (MC), profit (p), and marginal profit (Mp) in the following table.
Q
P
TR = P´Q
MR = TR/ Q
TC
MC = TC/ Q
p =
TR - TC
Mp = p/ Q
0
$200
$ 0
--
$ 0
--
$ 0
--
1
180
180
$180
100
$100
80
$ 80
2
320
175
65
3
420
100
240
65
180
30. Profit Maximization. Fill in the missing data for price (P), total revenue (TR), marginal revenue (MR),
total cost (TC), marginal cost (MC), profit (p), and marginal profit (Mp) in the following table.
Q
P
TR
MR
TC
MC
p
Mp
0
$160
$ 0
$ --
$ 0
$ --
$ 0
$ --
1
150
150
150
25
25
125
125
2
140
55
30
100
3
390
35
300
75
4
120
90
130
350
31. Profit Maximization. Fill in the missing data for price (P), total revenue (TR), marginal revenue (MR),
total cost (TC), marginal cost (MC), profit (p), and marginal profit (Mp) in the following table.
Q
P
TR
MR
TC
MC
p
Mp
0
$230
$ 0
$ --
$ 0
$ --
$ 0
$ --
1
210
10
200
2
380
20
150
3
170
130
30
450
32. Profit Maximization. Fill in the missing data for price (P), total revenue (TR), marginal revenue (MR),
total cost (TC), marginal cost (MC), profit (p), and marginal profit (Mp) in the following table.
Q
P
TR
MR
TC
MC
p
Mp
0
$50
$ 0
$--
$ 10
$--
$ -10
$--
1
45
45
45
60
50
-15
-5
33. Marginal Analysis. Characterize each of the following statements as true or false, and explain your answer.
34. Optimization. Describe each of the following statements as true or false, and explain your answer.
35. Marginal Analysis: Tables. Bree Van De Camp is a regional sales representative for Snappy Tools, Inc.,
and sells hand tools to auto mechanics in New England states. Van De Camp's goal is to maximize total
monthly commission income, which is figured at 6.25% of gross sales. In reviewing experience over the past
year, Van De Camp found the following relations between days spent in each state and weekly sales generated.
Days
Maine Sales
New Hampshire Sales
Vermont Sales
0
$ 4,000
$ 3,000
$ 1,900
1
10,000
7,000
5,200
2
15,000
10,600
7,400
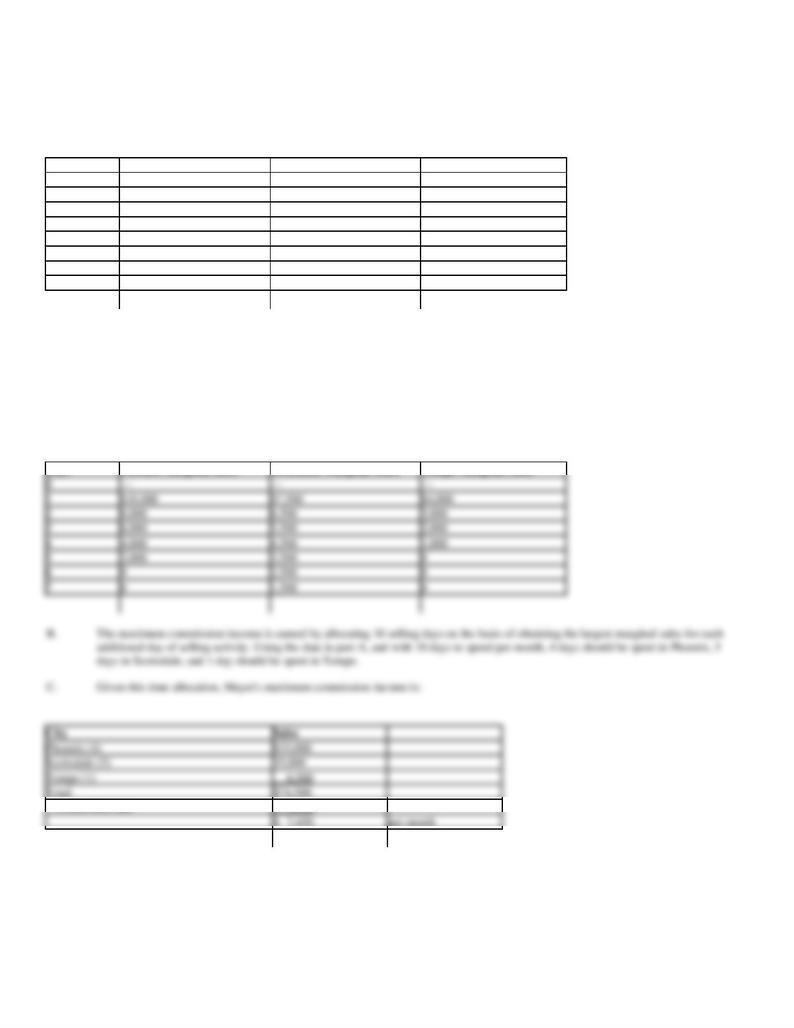
36. Marginal Analysis: Tables. Susan Mayer is a sales representative for the Desperate Insurance Company,
and sells life insurance policies to individuals in the Phoenix area. Mayer's goal is to maximize total monthly
commission income, which is figured at 10% of gross sales. In reviewing monthly experience over the past
year, Mayer found the following relations between days spent in each city and monthly sales generated.
Days
Phoenix Sales
Scottsdale Sales
Tempe Sales
0
$ 5,000
$ 7,500
$ 2,500
1
15,000
15,000
6,500
2
23,000
21,500
9,500
3
29,000
27,000
11,500
4
33,000
31,500
12,500
5
35,000
35,000
12,500
6
35,000
37,500
12,500
7
35,000
39,000
12,500
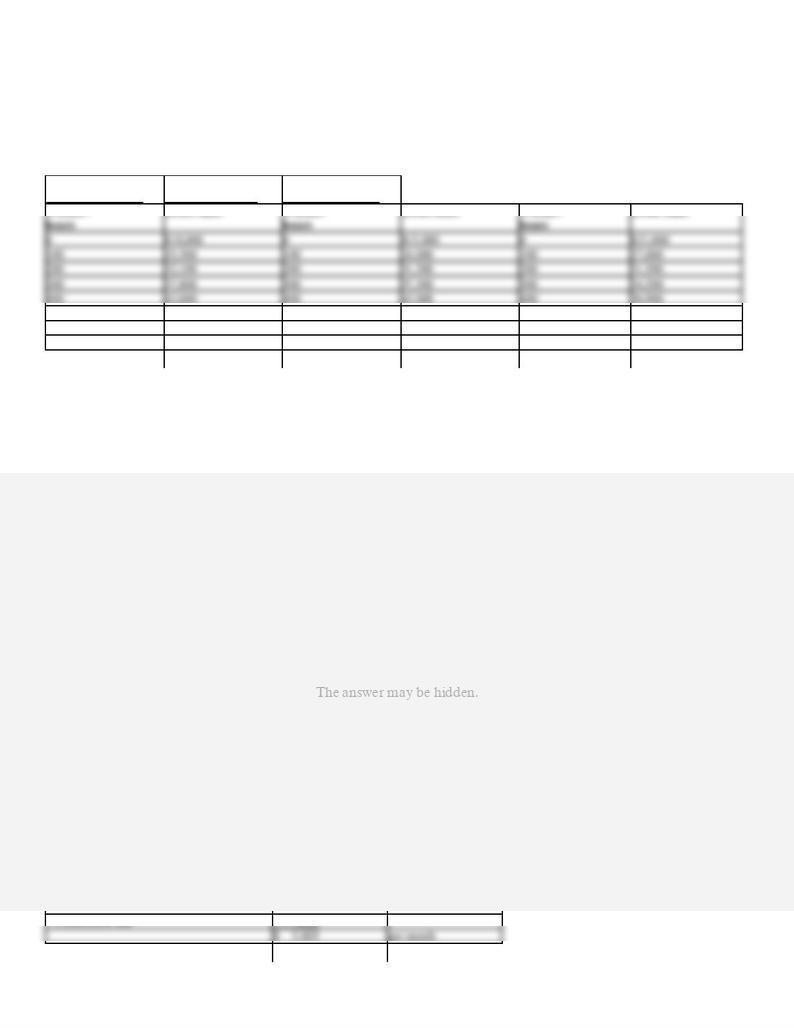
37. Marginal Analysis: Tables. Lynette Scavo is a telemarketing manager for Laser Supply, Inc., which sells
replacement chemicals to businesses with copy machines. Scavo's goal is to maximize total monthly
commission income, which is figured at 5% of gross sales of per telemarketer. In reviewing monthly experience
over the past year, Scavo found the following relations between worker-hours spent in each market segment and
monthly sales generated.
Businesses with less
than 250 employees
Businesses with
250-500 employees
Businesses with
over 500 employees
500
46,500
500
45,000
500
37.700
600
49,500
600
46,500
600
40,200
700
51,600
700
46,500
700
41,100
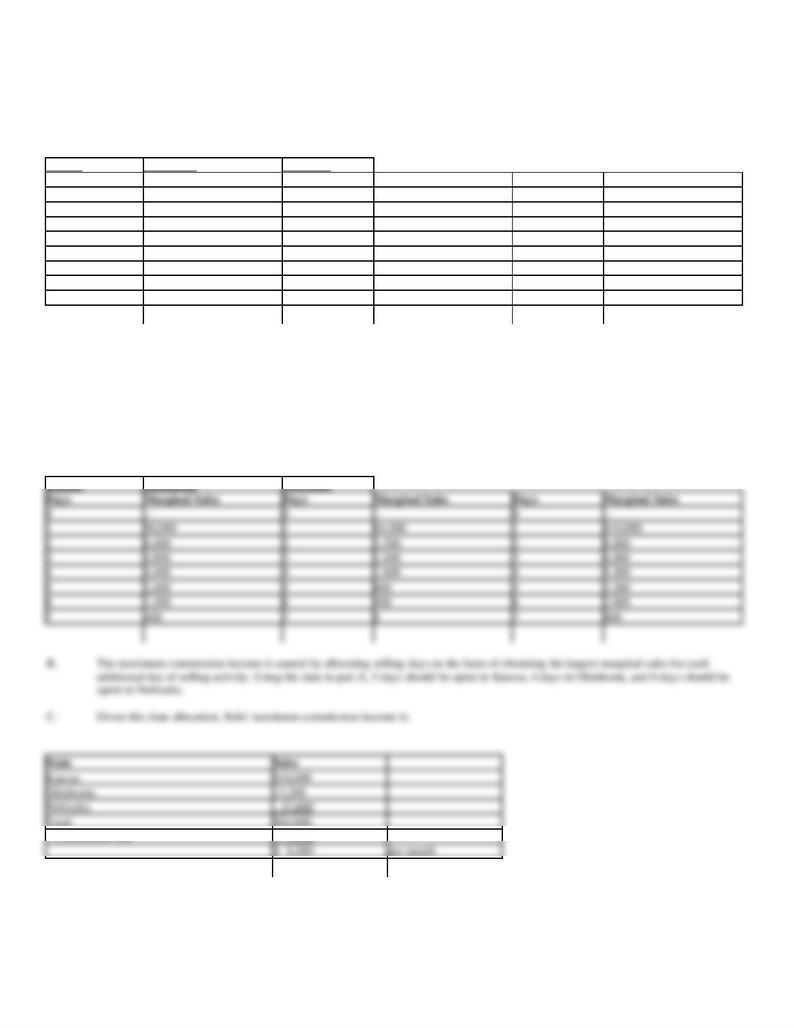
38. Marginal Analysis: Tables. Gabrielle Solis is a regional sales representative for Specialty Books, Inc., and
sells textbooks to universities in Midwestern states. Solis goal is to maximize total monthly commission
income, which is figured at 10% of gross sales. In reviewing monthly experience over the past year, Solis found
the following relations between days spent in each state and monthly sales generated:
Kansas
Oklahoma
Nebraska
Days
Gross Sales
Days
Gross Sales
Days
Gross Sales
0
$ 8,000
0
$ 2,000
0
$ 4,000
1
16,000
1
6,000
1
14,000
2
22,400
2
9,200
2
22,000

39. Profit Maximization: Equations. Woodland Instruments, Inc. operates in the highly competitive
electronics industry. Prices for its R2-D2 control switches are stable at $100 each. This means that P = MR =
$100 in this market. Engineering estimates indicate that relevant total and marginal cost relations for the R2-D2
model are:
TC
= $500,000 + $25Q + $0.0025Q2
MC
= TC/ Q = $25 + $0.005Q
40. Profit Maximization: Equations. Austin Heating & Air Conditioning, Inc., offers heating and air
conditioning system inspections in the Austin, Texas, market. Prices are stable at $50 per unit. This means that
P = MR = $50 in this market. Total cost (TC) and marginal cost (MC) relations are:
TC
= $1,000,000 + $10Q + $0.00025Q2
MC
= TC/ Q = $10 + $0.0005Q
41. Profit Maximization: Equations. Jewelry.com is a small but rapidly growing Internet retailer. A popular
42. Profit Maximization: Equations. Virus Soft, Inc., operates in the highly competitive virus detection and
protection software industry. Prices for its basic software are stable at $30 each. This means that P = MR = $30
in this market. Engineering estimates indicate that relevant total and marginal cost relations for this product are:
TC
= $750,000 + $20Q + $0.00002Q2
MC
= TC/ Q = $20 + $0.00004Q
43. Profit Maximization: Equations. Lone Star Insurance offers mail-order automobile insurance to
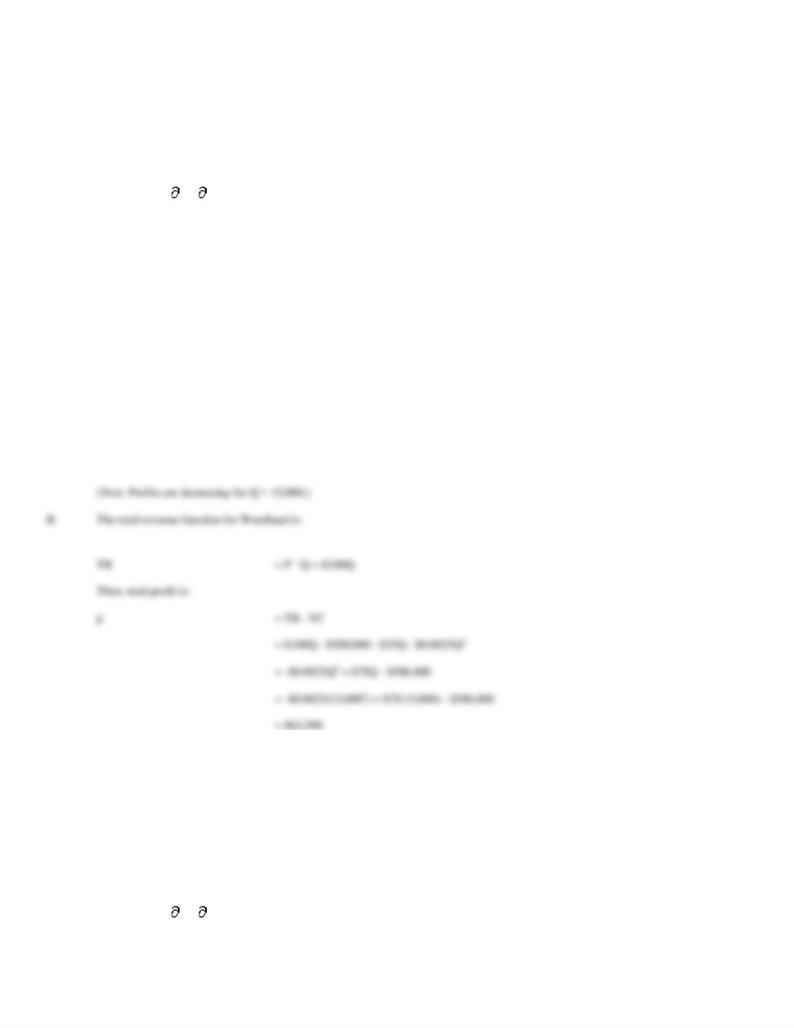
44. Profit Maximization: Equations. Dot.com Products, Inc., offers storage containers for fine china on the
Internet. The company is the low-cost retailer of these quilted boxes with fixed costs of $480,000 per year, plus
variable costs of $30 for each box. Annual demand and marginal revenue relations for the company are:
P
= $70 - $0.0005Q
MR
= TR/ Q = $70 - $0.001Q
45. Profit Maximization: Equations. Steam Cleanin, Inc., offers professional carpet cleaning to home owners
in Huntsville, Alabama. The company is the low-cost provider in this market with fixed costs of $168,750 per
year, plus variable costs of $10 per room of carpet cleaning. Annual demand and marginal revenue relations for
the company are:
P
= $40 - $0.001Q
MR
= TR/ Q = $40 - $0.002Q
46. Optimal Profit. Hardwood Cutters offers seasoned, split fireplace logs to consumers in Toledo, Ohio. The

47. Not-for-Profit Analysis. The Indigent Care Center, Inc., is a private, not-for-profit, medical treatment
center located in Denver, Colorado. An important issue facing Dr. Kerry Weaver, ICC's administrative director,
is the determination of an appropriate patient load (level of output). To efficiently employ scarce ICC resources,
the board of directors has instructed Weaver to maximize ICC operating surplus, defined as revenues minus
operating costs. They have also asked Weaver to determine the effects of two proposals for meeting new state
health care regulations. Plan A involves an increase in costs of $100 per patient, whereas plan B involves a
$20,000 increase in fixed expenses. In her calculations, Weaver has been asked to assume that a $3,000 fee will
be received from the state for each patient treated, irrespective of whether plan A or plan B is adopted.
In the calculations for determining an optimal patient level, Weaver regards price as fixed; therefore, P = MR =
$3,000. Prior to considering the effects of the new regulations, Weaver projects total and marginal cost relations
of:
TC
= $75,000 + $2,000Q + $2.5Q2
MC
= TC/ Q = $2,000 + $5Q
where Q is the number of ICC patients.
48. Average Cost Minimization. Commercial Recording, Inc., is a manufacturer and distributor of reel-to-reel
recording decks for commercial recording studios. Revenue and cost relations are:
TR
= $3,000Q - $0.5Q2
MR
= TR/ Q = $3,000 - $1Q
49. Average Cost Minimization. Better Buys, Inc., is a leading discount retailer of wide-screen digital and
cable-ready plasma HDTVs. Revenue and cost relations for a popular 55-inch model are:
TR
= $4,500Q - $0.1Q2
MR
= TR/ Q = $4,500 - $0.2Q

50. Revenue Maximization. Restaurant Marketing Services, Inc., offers affinity card marketing and monitoring
systems to fine dining establishments nationwide. Fixed costs are $600,000 per year. Sponsoring restaurants are
paid $60 for each card sold, and card printing and distribution costs are $3 per card. This means that RMS's
marginal costs are $63 per card. Based on recent sales experience, the estimated demand curve and marginal
revenue relations for are:
P
= $130 - $0.000125Q
MR
= TR/ Q = $130 - $0.00025Q
A.
Calculate output, price, total revenue, and total profit at the revenue-maximizing activity level.
B.
Calculate output, price, total revenue, and total profit at the profit-maximizing activity level.
C.
Compare and discuss your answers to parts A and B.
CHAPTER 2--ECONOMIC OPTIMIZATION Key
1. An equation is:
A. an analytical expression of functional relationships.
B. a visual representation of data.
6. Which of the following short run strategies should a manager select to obtain the highest degree of sales
24. If profit is to rise as output expands, then marginal profit must be:
A. falling.
B. constant.
C. positive.
D. rising.
25. An optimal decision:
A. minimizes output cost.
B. maximizes profits.
C. produces the result most consistent with decision maker objectives.
D. maximizes product quality.
26. Marginal Analysis. Consider the price (P) and output (Q) data in the following table.
Q
P
TR
MR
AR
0
$35
1
30
2
25
3
20
4
15
5
10
6
5
7
0
A.
Calculate the related total revenue (TR), marginal revenue (MR), and average revenue (AR) figures.
B.
At what output level is revenue maximized?
27. Marginal Analysis. Evaluate the price (P) and the output (Q) data in the following table.
Q
P
TR
MR
AR
0
$80
1
70
2
60
3
50
4
40
5
30
6
20
7
10
8
0
A.
Compute the related total revenue (TR), marginal revenue (MR), and average revenue (AR) figures:
B.
At what output level is revenue maximized?
28. Revenue Maximization. Assume the following output (Q) and price (P) data.
Q
P
TR
MR
AR
0
$50
1
45
2
40
3
35
4
30
5
25
6
20
7
15
8
10
9
5
10
0
A.
At what output level is revenue maximized?
B.
Why is marginal revenue less than average revenue at each price level?
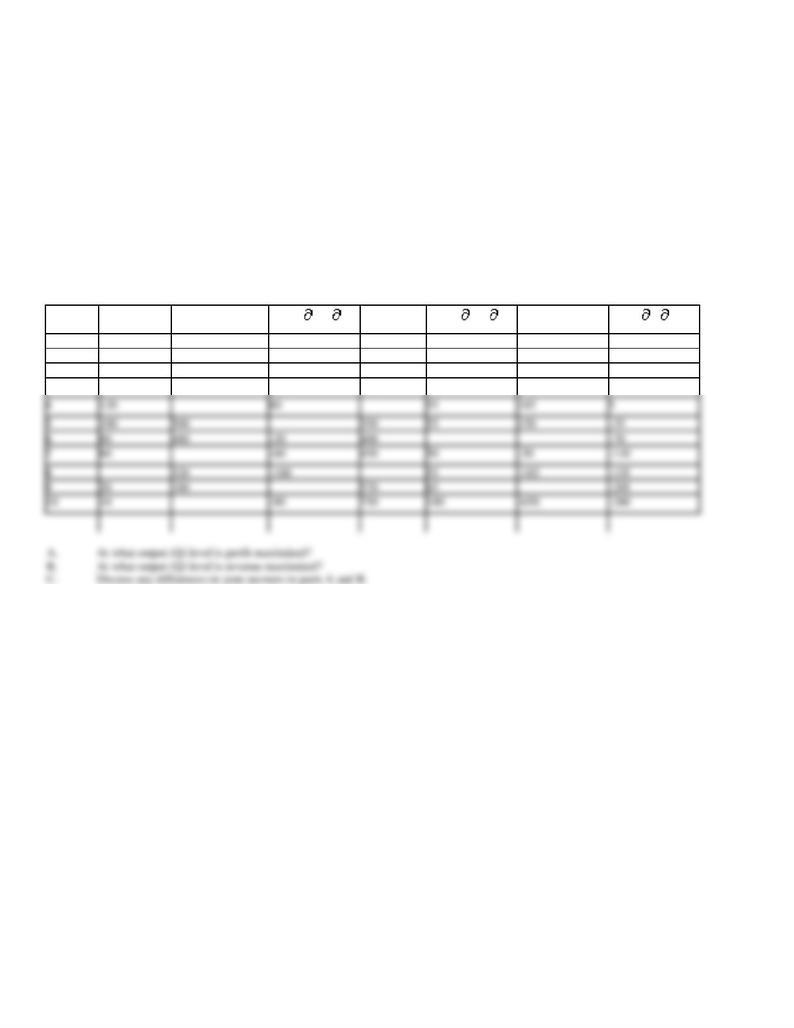
29. Profit Maximization. Fill in the missing data for price (P), total revenue (TR), marginal revenue (MR),
total cost (TC), marginal cost (MC), profit (p), and marginal profit (Mp) in the following table.
Q
P
TR = P´Q
MR = TR/ Q
TC
MC = TC/ Q
p =
TR - TC
Mp = p/ Q
0
$200
$ 0
--
$ 0
--
$ 0
--
1
180
180
$180
100
$100
80
$ 80
2
320
175
65
3
420
100
240
65
180
4
120
60
55
185
5
5
100
500
350
55
150
-35
6
80
480
-20
400
-70
7
60
-60
450
50
-30
-110
8
320
-100
55
-185
-155
9
20
180
570
65
-205
10
10
-80
750
180
-650
-260
A.
At what output (Q) level is profit maximized?
B.
At what output (Q) level is revenue maximized?
C.
Discuss any differences in your answers to parts A and B.
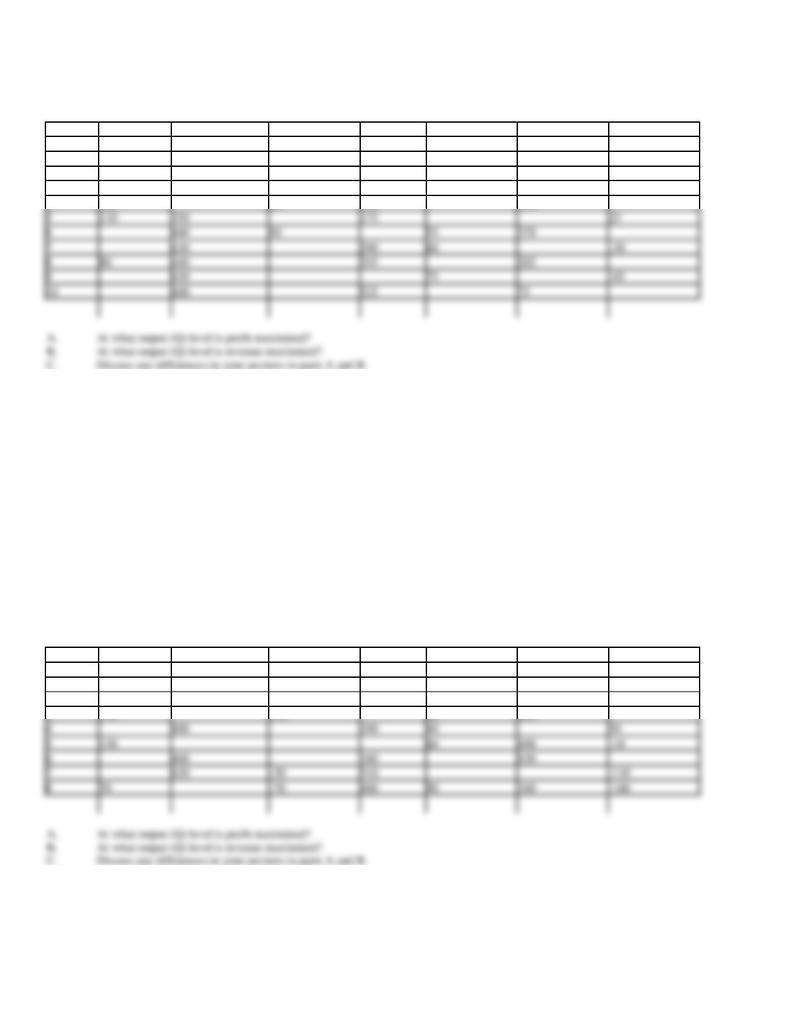
30. Profit Maximization. Fill in the missing data for price (P), total revenue (TR), marginal revenue (MR),
total cost (TC), marginal cost (MC), profit (p), and marginal profit (Mp) in the following table.
Q
P
TR
MR
TC
MC
p
Mp
0
$160
$ 0
$ --
$ 0
$ --
$ 0
$ --
1
150
150
150
25
25
125
125
2
140
55
30
100
3
390
35
300
75
4
120
90
130
350
5
110
550
175
25
6
600
50
55
370
7
630
290
60
-30
8
80
640
355
285
9
630
75
-85
10
600
525
75
A.
At what output (Q) level is profit maximized?
B.
At what output (Q) level is revenue maximized?
C.
Discuss any differences in your answers to parts A and B.
A.
Profit increases so long as MR > MC and Mp > 0. In this problem, profit is maximized at Q = 5 where p = $375 (and TR = $550).

31. Profit Maximization. Fill in the missing data for price (P), total revenue (TR), marginal revenue (MR),
total cost (TC), marginal cost (MC), profit (p), and marginal profit (Mp) in the following table.
Q
P
TR
MR
TC
MC
p
Mp
0
$230
$ 0
$ --
$ 0
$ --
$ 0
$ --
1
210
10
200
2
380
20
150
3
170
130
30
450
4
600
100
40
50
5
130
60
490
-10
6
660
160
430
7
630
-30
310
-110
8
70
-70
400
90
160
-160
A.
At what output (Q) level is profit maximized?
B.
At what output (Q) level is revenue maximized?
C.
Discuss any differences in your answers to parts A and B.
A.
Profit increases so long as MR > MC and Mp > 0. In this problem, profit is maximized at Q = 4 where p = 500 (and TR = $600).

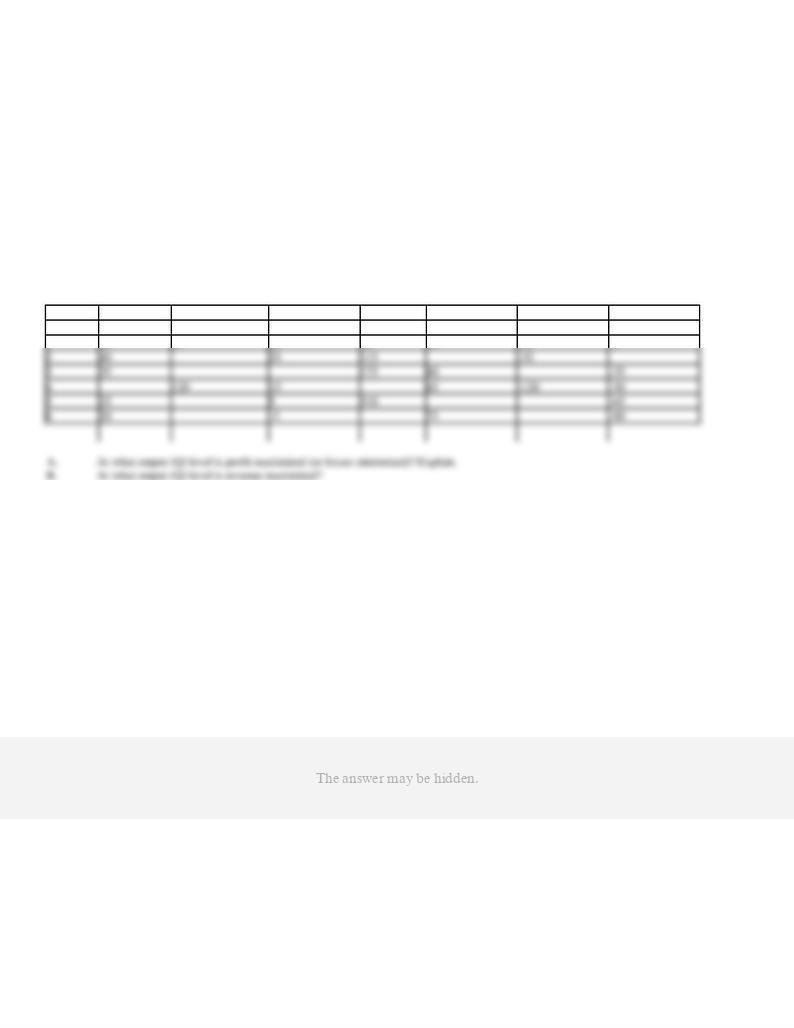
32. Profit Maximization. Fill in the missing data for price (P), total revenue (TR), marginal revenue (MR),
total cost (TC), marginal cost (MC), profit (p), and marginal profit (Mp) in the following table.
Q
P
TR
MR
TC
MC
p
Mp
0
$50
$ 0
$--
$ 10
$--
$ -10
$--
1
45
45
45
60
50
-15
-5
2
40
35
115
-35
3
35
175
60
-35
4
120
15
65
-120
-50
5
25
5
310
-65
6
20
-5
75
-80
A.
At what output (Q) level is profit maximized (or losses minimized)? Explain.
B.
At what output (Q) level is revenue maximized?
33. Marginal Analysis. Characterize each of the following statements as true or false, and explain your answer.
A.
Given a downward-sloping demand curve and positive marginal costs, profit-maximizing firms will always sell less output and at
higher prices than will revenue-maximizing firms.
B.
Profits will be maximized when marginal revenue equals marginal cost.
C.
Total profit is the difference between total revenue and total cost and will always exceed zero at the profit-maximizing activity level.
D.
Marginal cost must be less than average cost at the average cost minimizing output level.
E.
The demand curve will be downward sloping if marginal revenue is less than price.
34. Optimization. Describe each of the following statements as true or false, and explain your answer.
A.
To maximize the value of the firm, management should always produce the level of output that maximizes short run profit.
B.
Average profit equals the slope of the line tangent to the total product function at each level of output.
C.
Marginal profit equals zero at the profit maximizing level of output.
D.
To maximize profit, total revenue must also be maximized.
E.
Marginal cost equals average cost at the average cost minimizing level of output.
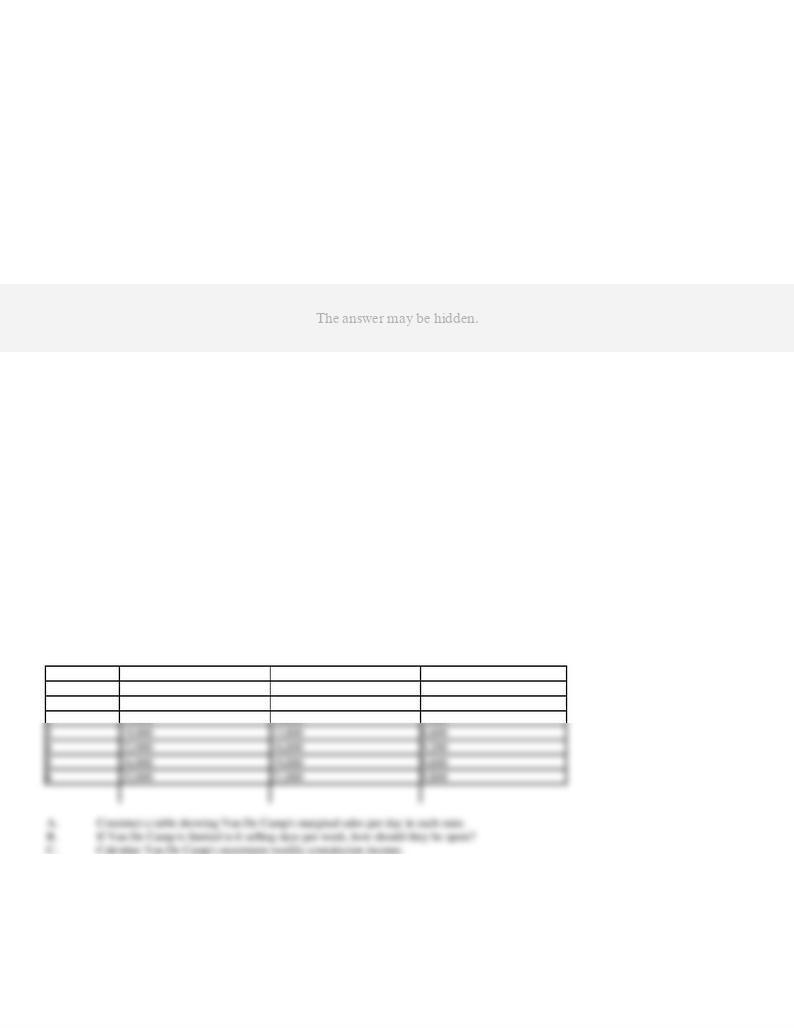
35. Marginal Analysis: Tables. Bree Van De Camp is a regional sales representative for Snappy Tools, Inc.,
and sells hand tools to auto mechanics in New England states. Van De Camp's goal is to maximize total
monthly commission income, which is figured at 6.25% of gross sales. In reviewing experience over the past
year, Van De Camp found the following relations between days spent in each state and weekly sales generated.
Days
Maine Sales
New Hampshire Sales
Vermont Sales
0
$ 4,000
$ 3,000
$ 1,900
1
10,000
7,000
5,200
2
15,000
10,600
7,400
3
19,000
13,800
8,600
4
22,000
16,600
9,200
5
24,000
19,000
9,600
6
25,000
21,000
9,800
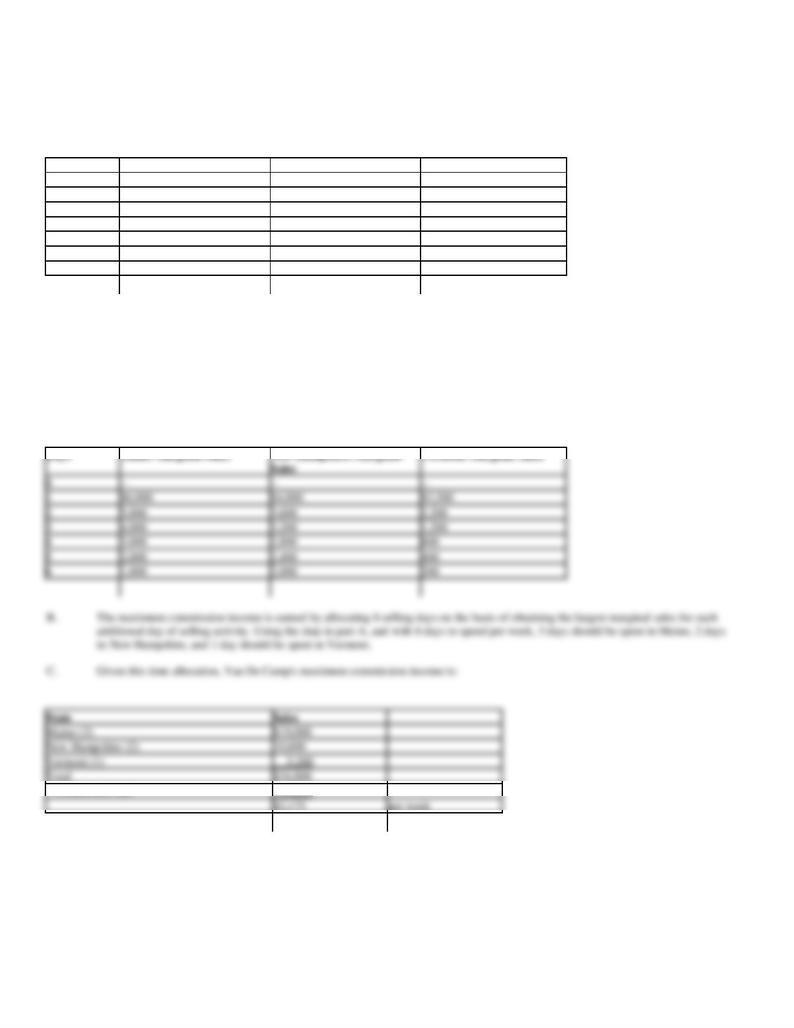
A.
Construct a table showing Van De Camp's marginal sales per day in each state.
B.
If Van De Camp is limited to 6 selling days per week, how should they be spent?
C.
Calculate Van De Camp's maximum weekly commission income.
A.
´ Commission rate
0.0625
36. Marginal Analysis: Tables. Susan Mayer is a sales representative for the Desperate Insurance Company,
and sells life insurance policies to individuals in the Phoenix area. Mayer's goal is to maximize total monthly
commission income, which is figured at 10% of gross sales. In reviewing monthly experience over the past
year, Mayer found the following relations between days spent in each city and monthly sales generated.
Days
Phoenix Sales
Scottsdale Sales
Tempe Sales
0
$ 5,000
$ 7,500
$ 2,500
1
15,000
15,000
6,500
2
23,000
21,500
9,500
3
29,000
27,000
11,500
4
33,000
31,500
12,500
5
35,000
35,000
12,500
6
35,000
37,500
12,500
7
35,000
39,000
12,500
A.
Construct a table showing Mayer's marginal sales per day in each city.
B.
If administrative duties limit Mayer to only 10 selling days per month, how should she spend them?
C.
Calculate Mayer's maximum monthly commission income.
A.
Days
Phoenix Marginal Sales
Scottsdale Marginal Sales
Tempe Marginal Sales
´ Commission rate
0.10
37. Marginal Analysis: Tables. Lynette Scavo is a telemarketing manager for Laser Supply, Inc., which sells
replacement chemicals to businesses with copy machines. Scavo's goal is to maximize total monthly
commission income, which is figured at 5% of gross sales of per telemarketer. In reviewing monthly experience
over the past year, Scavo found the following relations between worker-hours spent in each market segment and
monthly sales generated.
Businesses with less
than 250 employees
Businesses with
250-500 employees
Businesses with
over 500 employees
500
46,500
500
45,000
500
37.700
600
49,500
600
46,500
600
40,200
700
51,600
700
46,500
700
41,100
A.
Construct a table showing Scavo's marginal sales per 100 worker-hours in each market segment.
B.
Scavo employs telemarketers for 1,000 worker-hours per month, how should their hours be allocated among market segments?
C.
Calculate Scavo's maximum monthly commission income.
´ Commission rate
0.05
38. Marginal Analysis: Tables. Gabrielle Solis is a regional sales representative for Specialty Books, Inc., and
sells textbooks to universities in Midwestern states. Solis goal is to maximize total monthly commission
income, which is figured at 10% of gross sales. In reviewing monthly experience over the past year, Solis found
the following relations between days spent in each state and monthly sales generated:
Kansas
Oklahoma
Nebraska
Days
Gross Sales
Days
Gross Sales
Days
Gross Sales
0
$ 8,000
0
$ 2,000
0
$ 4,000
1
16,000
1
6,000
1
14,000
2
22,400
2
9,200
2
22,000
3
27,200
3
11,600
3
28,000
4
31,600
4
13,200
4
32,400
5
34,000
5
14,000
5
35,600
6
35,200
6
14,400
6
37,600
7
35,600
7
14,400
7
38,400
A.
Construct a table showing Solis marginal sales per day in each state.
B.
If administrative duties limit Solis to only 15 selling days per month, how should he spend them?
C.
Calculate Solis maximum monthly commission income.
A.
Kansas
Oklahoma
Nebraska
´ Commission rate
0.10
39. Profit Maximization: Equations. Woodland Instruments, Inc. operates in the highly competitive
electronics industry. Prices for its R2-D2 control switches are stable at $100 each. This means that P = MR =
$100 in this market. Engineering estimates indicate that relevant total and marginal cost relations for the R2-D2
model are:
TC
= $500,000 + $25Q + $0.0025Q2
MC
= TC/ Q = $25 + $0.005Q
A.
Calculate the output level that will maximize R2-D2 profit.
B.
Calculate this maximum profit.
A.
To find the profit-maximizing level of output, set MR = MC and solve for Q:
MR
= MC
$100
= $25 + $0.005Q
0.005Q
= 75
Q
= 15,000
40. Profit Maximization: Equations. Austin Heating & Air Conditioning, Inc., offers heating and air
conditioning system inspections in the Austin, Texas, market. Prices are stable at $50 per unit. This means that
P = MR = $50 in this market. Total cost (TC) and marginal cost (MC) relations are:
TC
= $1,000,000 + $10Q + $0.00025Q2
MC
= TC/ Q = $10 + $0.0005Q
A.
Calculate the output level that will maximize profit.
B.
Calculate this maximum profit.
A.
To find the profit-maximizing level of output, set MR = MC and solve for Q:
MR
= MC
$50
= $10 + $0.0005Q
0.0005Q
= 40
Q
= 80,000
41. Profit Maximization: Equations. Jewelry.com is a small but rapidly growing Internet retailer. A popular
product is its standard 14k white gold diamond anniversary rings (1/4 ct. tw.) that retail for $250. Prices are
stable, so P = MR = $250 in this market. Total and marginal cost relations for this product are:
TC
= $3,250,000 + $70Q + $0.002Q2
MC
= TC/ Q = $70 + $0.004Q
A.
Calculate the output level that will maximize profit.
B.
Calculate this maximum profit.
A.
To find the profit-maximizing level of output, set MR = MC and solve for Q:
MR
= MC
$250
= $70 + $0.004Q
0.004Q
= 180
Q
= 45,000
42. Profit Maximization: Equations. Virus Soft, Inc., operates in the highly competitive virus detection and
protection software industry. Prices for its basic software are stable at $30 each. This means that P = MR = $30
in this market. Engineering estimates indicate that relevant total and marginal cost relations for this product are:
TC
= $750,000 + $20Q + $0.00002Q2
MC
= TC/ Q = $20 + $0.00004Q
A.
Calculate the output level that will maximize profit.
B.
Calculate this maximum profit.
A.
To find the profit-maximizing level of output we set MR = MC and solve for Q:
MR
= MC
$30
= $20 + $0.00004Q
0.00004Q
= 10
Q
= 250,000
43. Profit Maximization: Equations. Lone Star Insurance offers mail-order automobile insurance to
preferred-risk drivers in the state of Texas. The company is the low-cost provider of insurance in this market
with fixed costs of $18 million per year, plus variable costs of $750 for each driver insured on an annual basis.
Annual demand and marginal revenue relations for the company are:
P
= $1,500 - $0.005Q
MR
= TR/ Q = $1,500 - $0.01Q
A.
Calculate the profit-maximizing activity level.
B.
Calculate the company's optimal profit and return-on-sales levels.
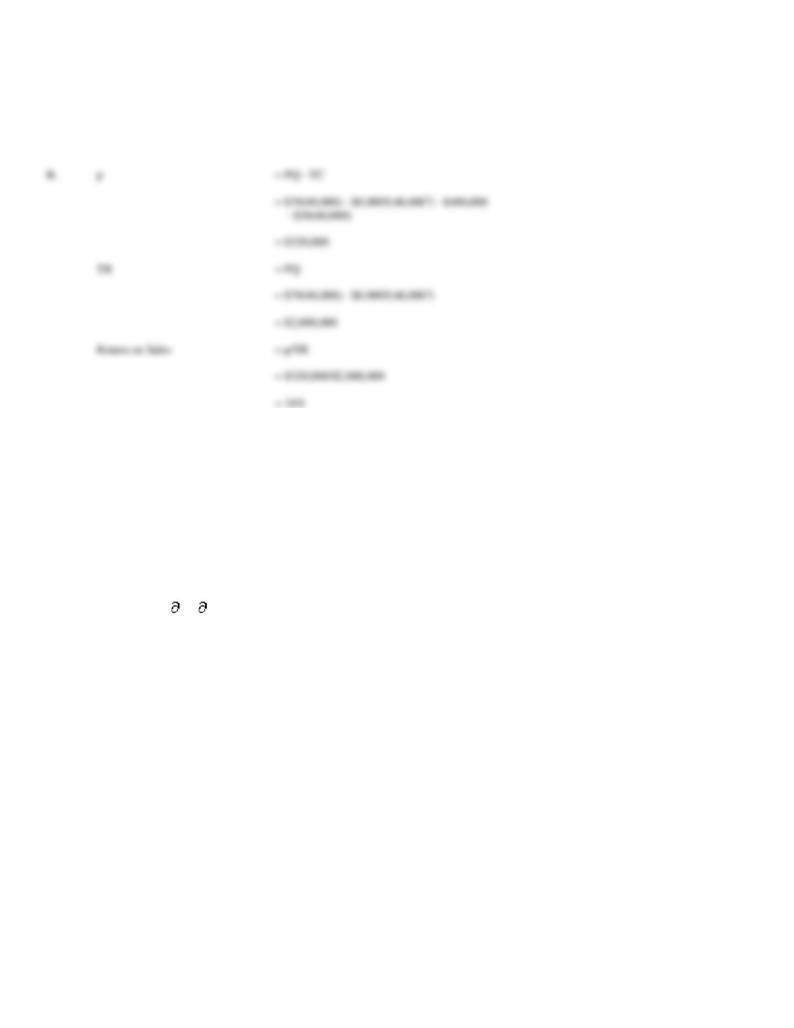
A.
Set MR = MC and solve for Q to find the profit-maximizing activity level:
MR
= MC
$1,500 - $0.01Q
= $750
0.01Q
= 750
Q
= 75,000
44. Profit Maximization: Equations. Dot.com Products, Inc., offers storage containers for fine china on the
Internet. The company is the low-cost retailer of these quilted boxes with fixed costs of $480,000 per year, plus
variable costs of $30 for each box. Annual demand and marginal revenue relations for the company are:
P
= $70 - $0.0005Q
MR
= TR/ Q = $70 - $0.001Q
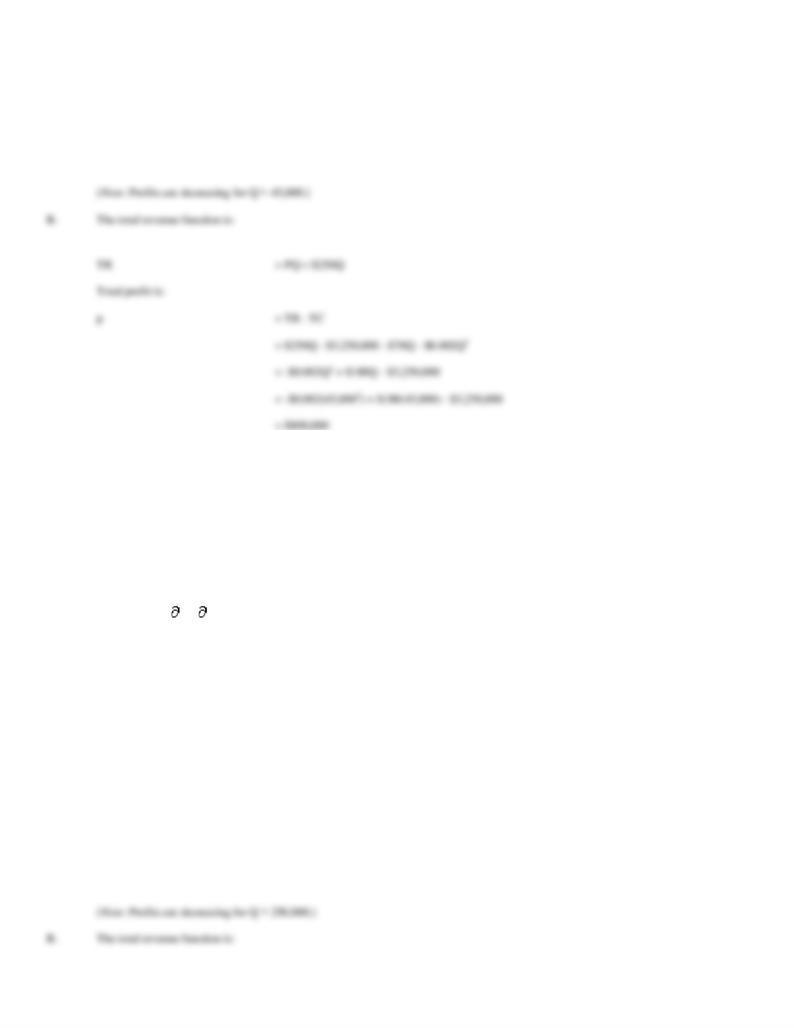
A.
Calculate the profit-maximizing activity level.
B.
Calculate the company's optimal profit and return-on-sales levels.
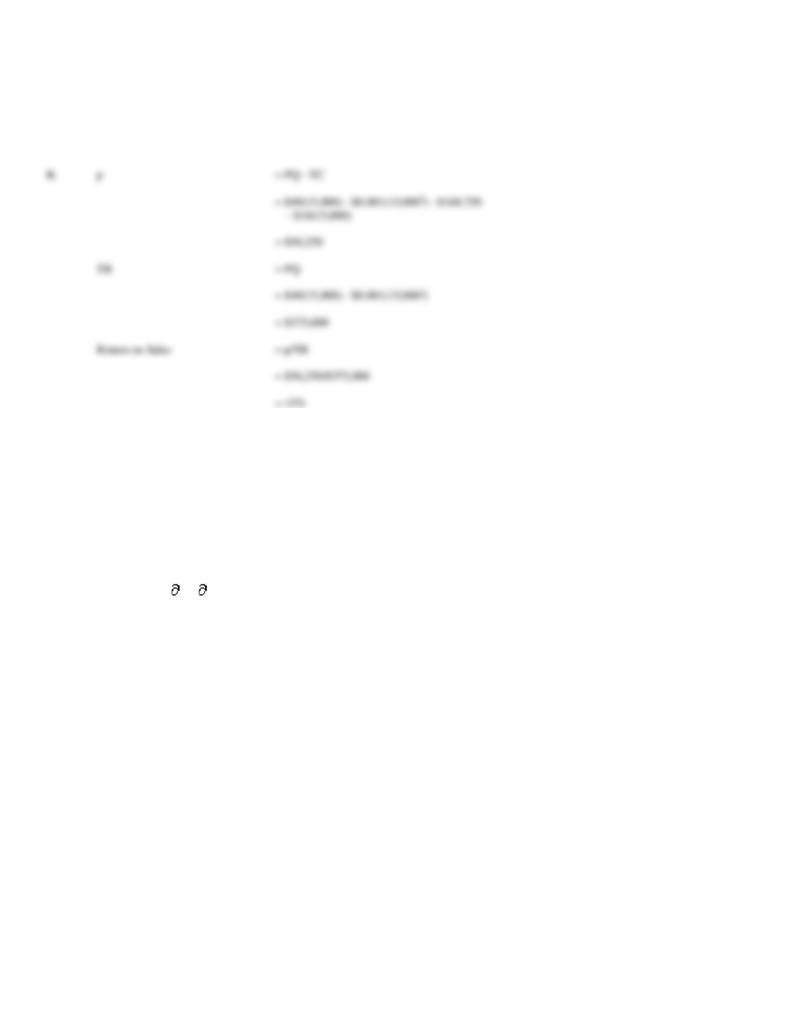
A.
Set MR = MC and solve for Q to find the profit-maximizing activity level:
MR
= MC
$70 - $0.001Q
= $30
0.001Q
= 40
Q
= 40,000
45. Profit Maximization: Equations. Steam Cleanin, Inc., offers professional carpet cleaning to home owners
in Huntsville, Alabama. The company is the low-cost provider in this market with fixed costs of $168,750 per
year, plus variable costs of $10 per room of carpet cleaning. Annual demand and marginal revenue relations for
the company are:
P
= $40 - $0.001Q
MR
= TR/ Q = $40 - $0.002Q
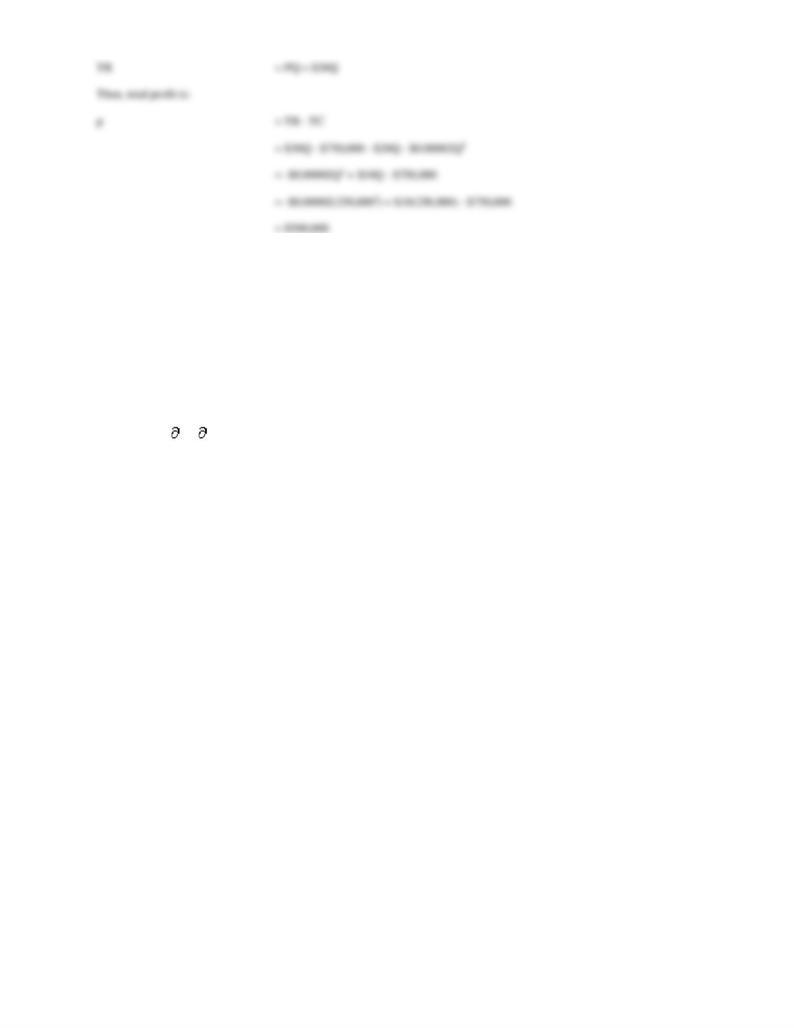
A.
Calculate the profit-maximizing activity level.
B.
Calculate the company's optimal profit and return-on-sales levels.
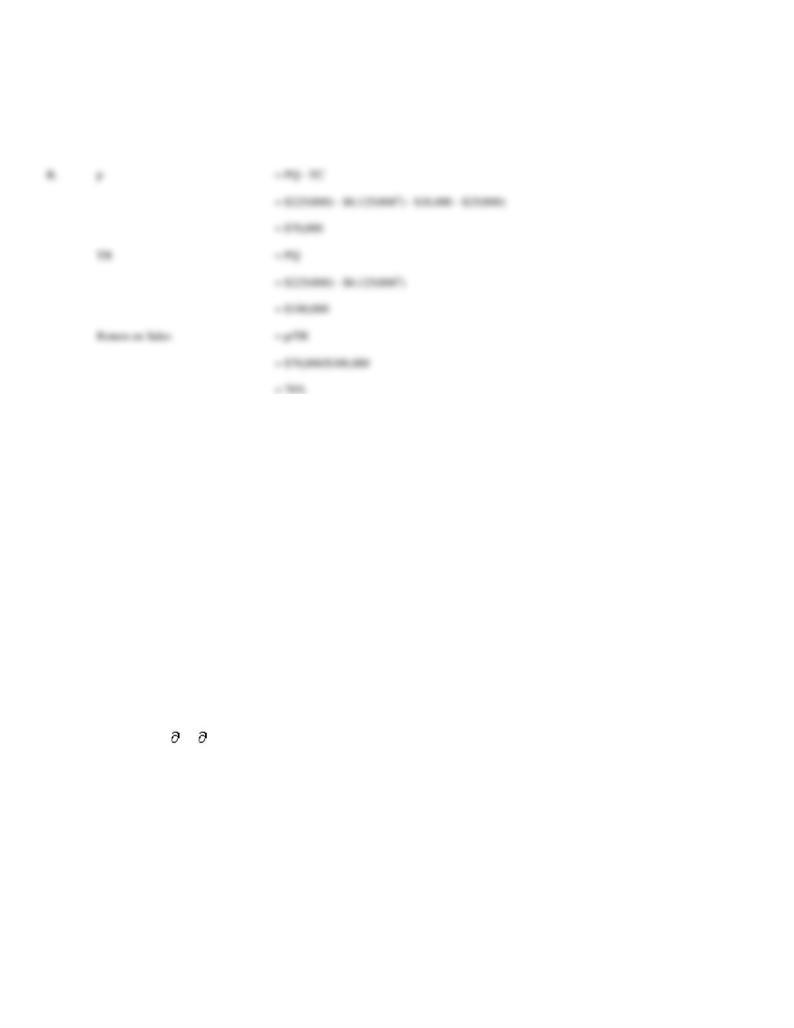
A.
Set MR = MC and solve for Q to find the profit-maximizing activity level:
MR
= MC
$40 - $0.002Q
= $10
0.002Q
= 30
Q
= 15,000
46. Optimal Profit. Hardwood Cutters offers seasoned, split fireplace logs to consumers in Toledo, Ohio. The
company is the low-cost provider of firewood in this market with fixed costs of $10,000 per year, plus variable
costs of $25 for each cord of firewood. Annual demand and marginal revenue relations for the company are:
P
= $225 - $0.125Q
MR
= TR/ Q = $225 - $0.25Q
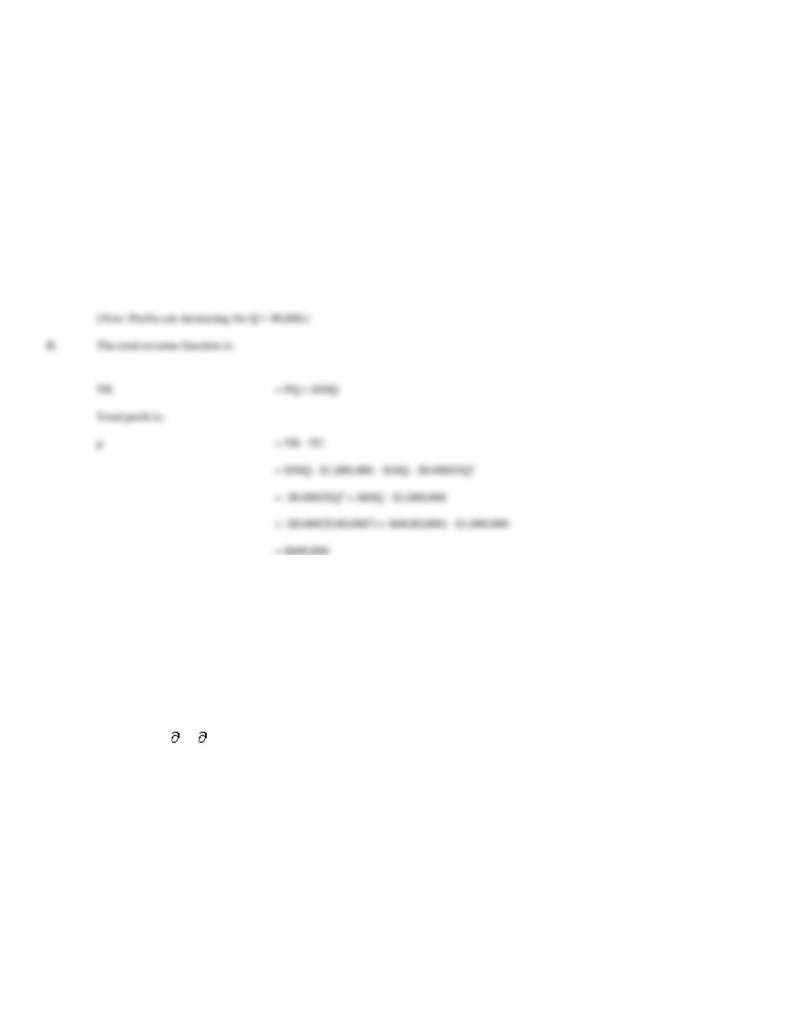
A.
Calculate the profit-maximizing activity level.
B.
Calculate the company's optimal profit and return-on-sales levels.
A.
Set MR = MC and solve for Q to find the profit-maximizing activity level:
MR
= MC
$225 - $0.25Q
= $25
0.25Q
= 200
Q
= 800
47. Not-for-Profit Analysis. The Indigent Care Center, Inc., is a private, not-for-profit, medical treatment
center located in Denver, Colorado. An important issue facing Dr. Kerry Weaver, ICC's administrative director,
is the determination of an appropriate patient load (level of output). To efficiently employ scarce ICC resources,
the board of directors has instructed Weaver to maximize ICC operating surplus, defined as revenues minus
operating costs. They have also asked Weaver to determine the effects of two proposals for meeting new state
health care regulations. Plan A involves an increase in costs of $100 per patient, whereas plan B involves a
$20,000 increase in fixed expenses. In her calculations, Weaver has been asked to assume that a $3,000 fee will
be received from the state for each patient treated, irrespective of whether plan A or plan B is adopted.
In the calculations for determining an optimal patient level, Weaver regards price as fixed; therefore, P = MR =
$3,000. Prior to considering the effects of the new regulations, Weaver projects total and marginal cost relations
of:
TC
= $75,000 + $2,000Q + $2.5Q2
MC
= TC/ Q = $2,000 + $5Q
where Q is the number of ICC patients.
A.
Before considering the effects of the proposed regulations, calculate ICC's optimal patient and operating surplus levels.
B.
Calculate these levels under plan A.
C.
Calculate these levels under plan B.
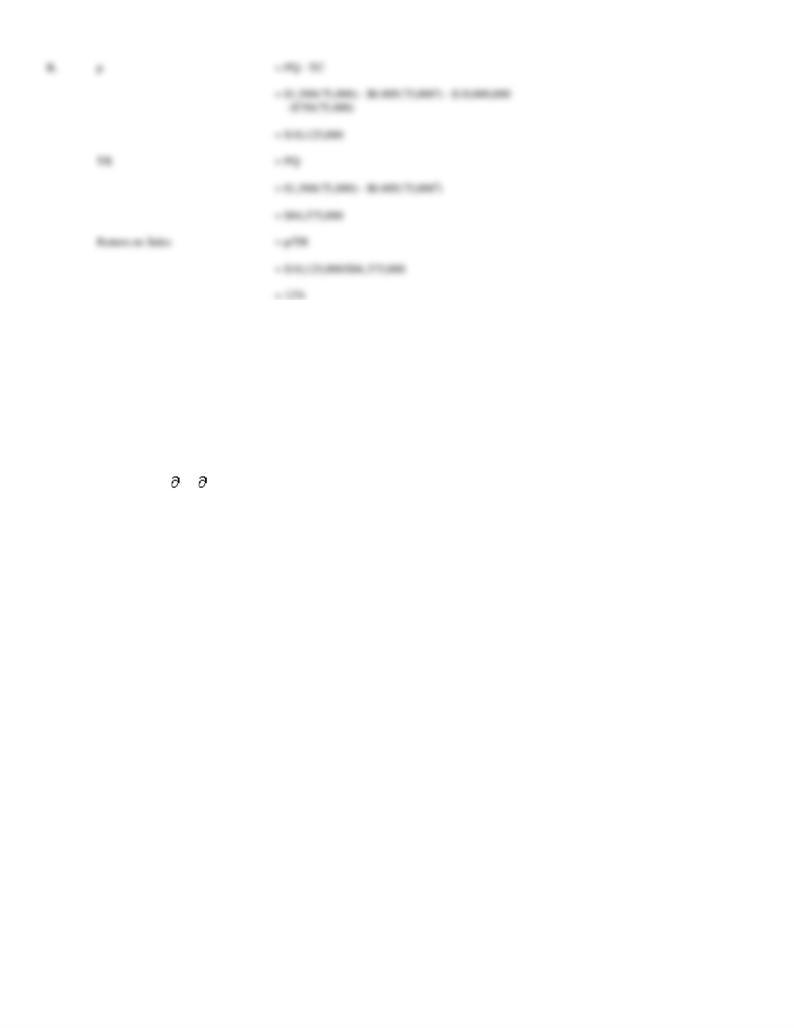
A.
Set MR = MC, and solve for Q to find the operating surplus (profit) maximizing activity level:
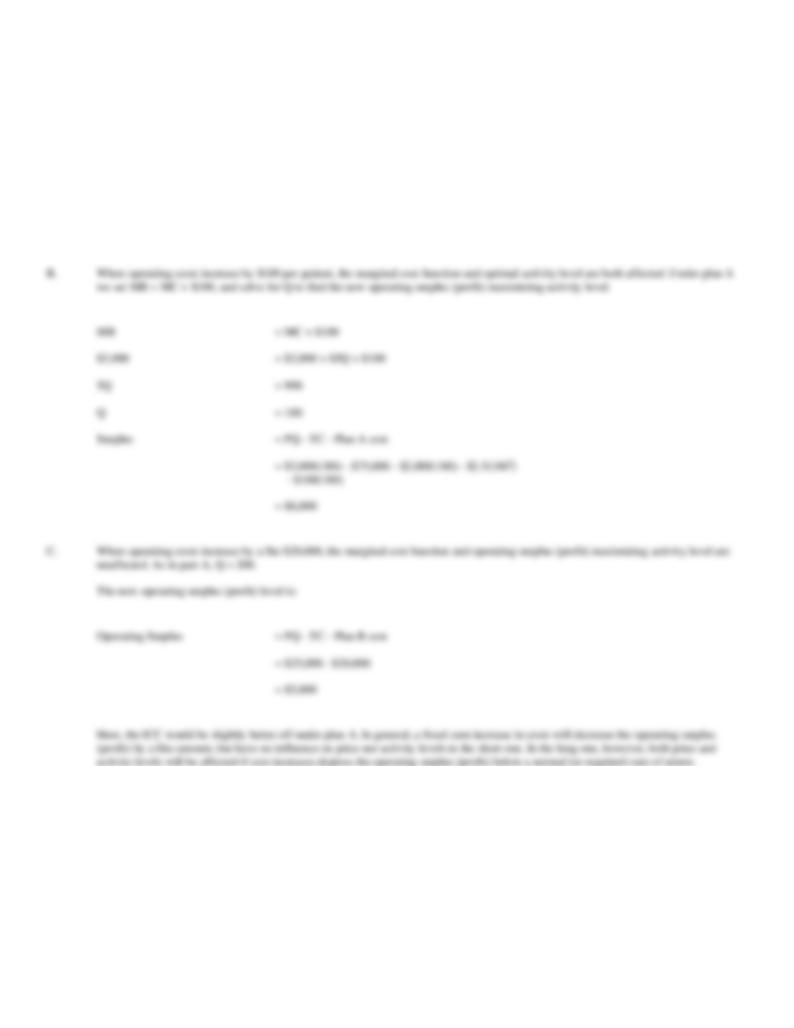
MR
= MC
$3,000
= $2,000 + $5Q
5Q
= 1,000
Q
= 200
Surplus
= PQ - TC
= $3,000(200) - $75,000 - $2,000(200) - $2.5(2002)
= $25,000
48. Average Cost Minimization. Commercial Recording, Inc., is a manufacturer and distributor of reel-to-reel
recording decks for commercial recording studios. Revenue and cost relations are:
TR
= $3,000Q - $0.5Q2
MR
= TR/ Q = $3,000 - $1Q
TC
= $100,000 + $1,500Q + $0.1Q2
MC
= TC/ Q = $1,500 + $0.2Q
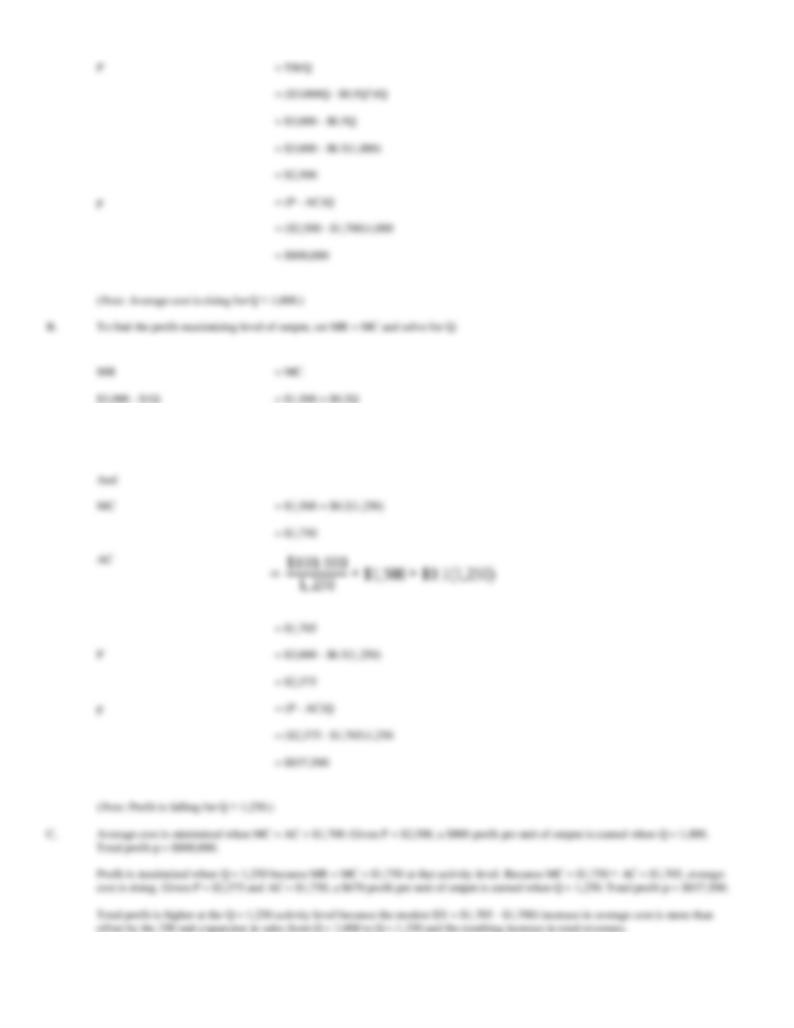
A.
Calculate output, marginal cost, average cost, price, and profit at the average cost-minimizing activity level.
B.
Calculate these values at the profit-maximizing activity level.
C.
Compare and discuss your answers to parts A and B.
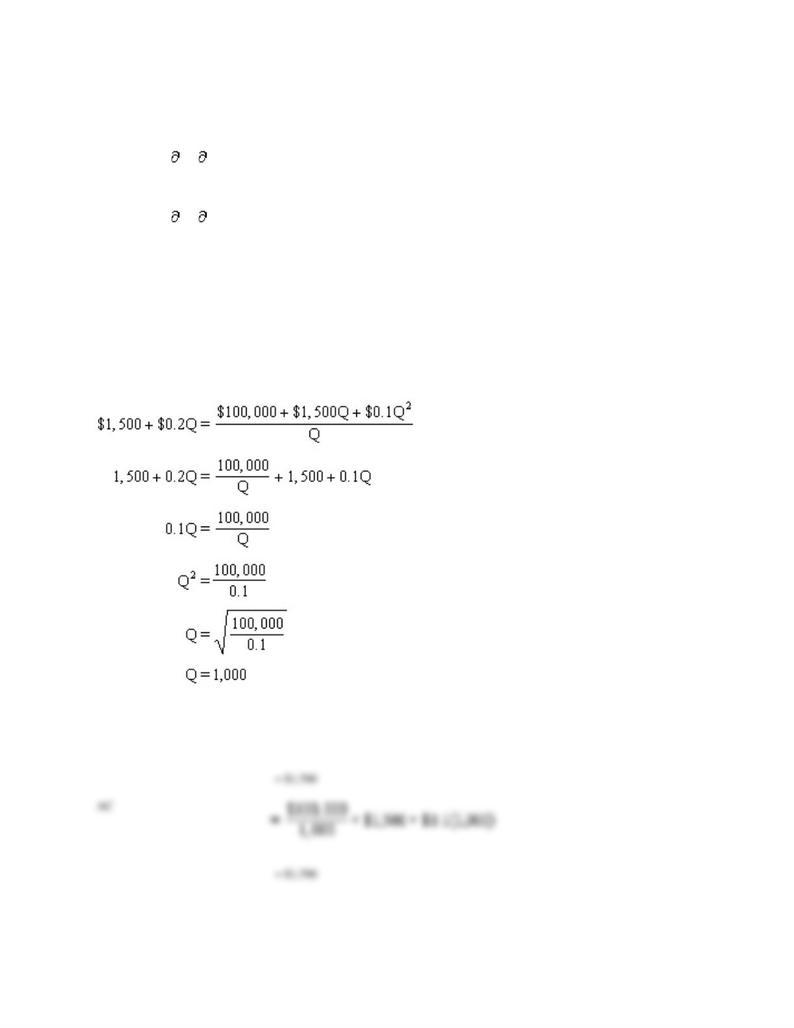
A.
To find the average cost-minimizing level of output, set MC = AC and solve for Q:
And,
MC
= $1,500 + $0.2(1,000)
1.2Q
= 1,500
Q
= 1,250
49. Average Cost Minimization. Better Buys, Inc., is a leading discount retailer of wide-screen digital and
cable-ready plasma HDTVs. Revenue and cost relations for a popular 55-inch model are:
TR
= $4,500Q - $0.1Q2
MR
= TR/ Q = $4,500 - $0.2Q
TC
= $2,000,000 + $1,500Q + $0.5Q2
MC
= TC/ Q = $1,500 + $1Q
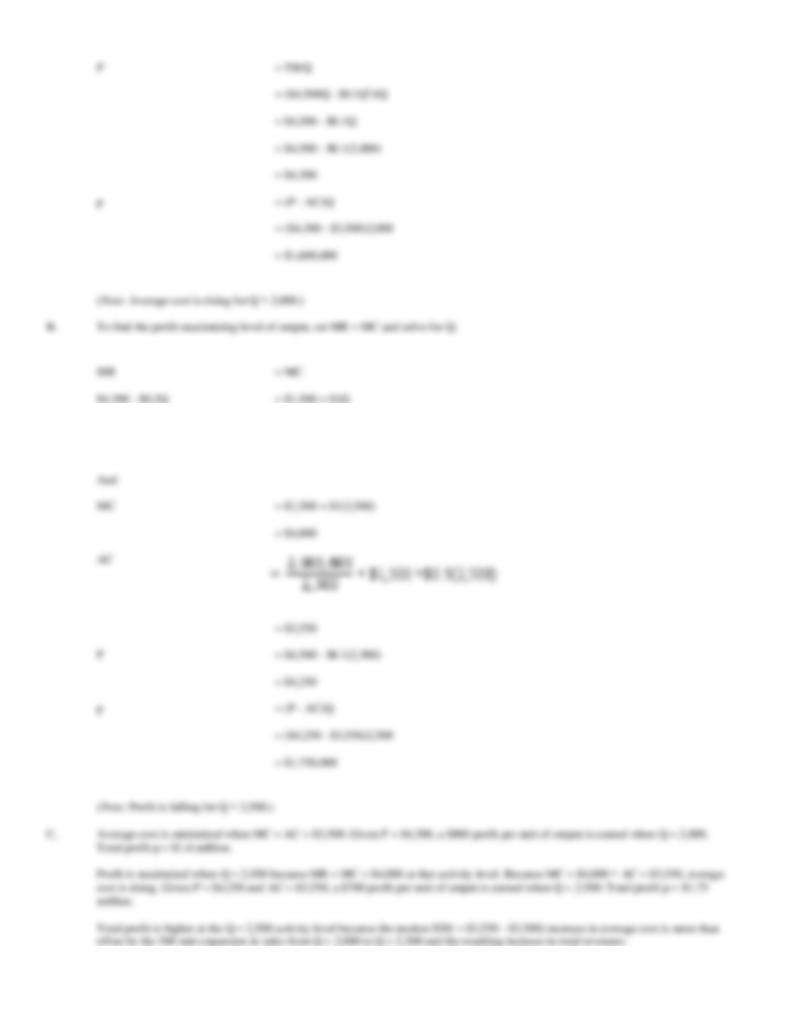
A.
Calculate output, marginal cost, average cost, price, and profit at the average cost-minimizing activity level.
B.
Calculate these values at the profit-maximizing activity level.
C.
Compare and discuss your answers to parts A and B.
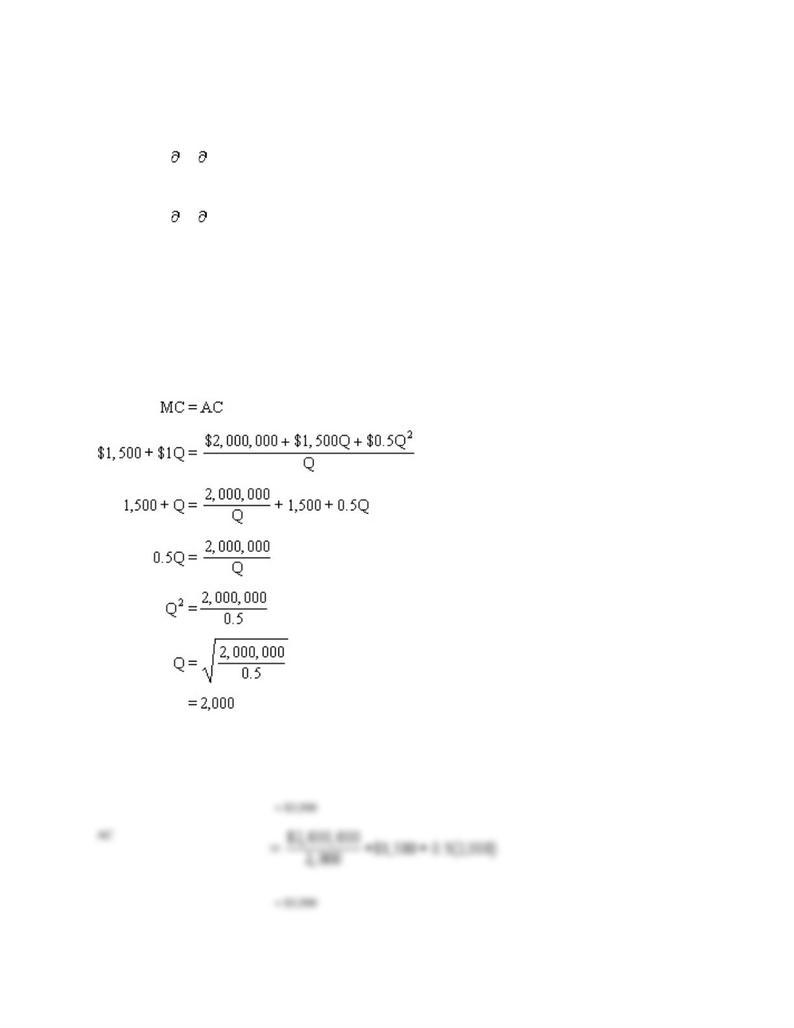
A.
To find the average cost-minimizing level of output, set MC = AC and solve for Q:
And,
MC
= $1,500 + $1(2,000)
1.2Q
= 3,000
Q
= 2,500
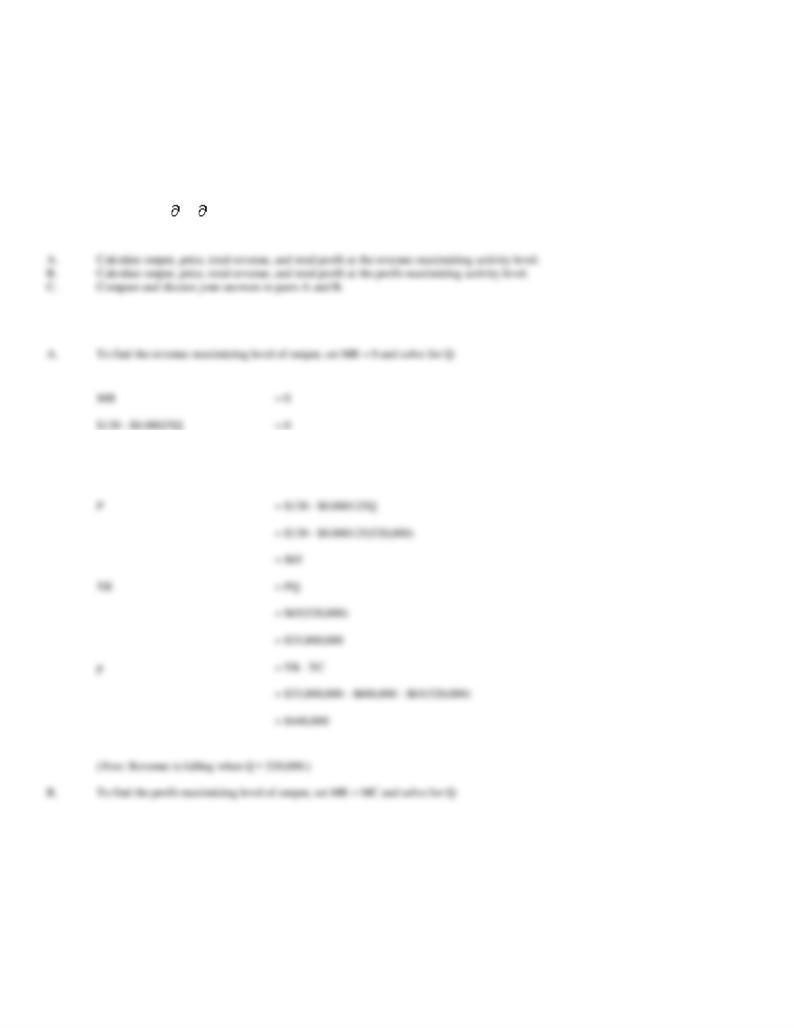
50. Revenue Maximization. Restaurant Marketing Services, Inc., offers affinity card marketing and monitoring
systems to fine dining establishments nationwide. Fixed costs are $600,000 per year. Sponsoring restaurants are
paid $60 for each card sold, and card printing and distribution costs are $3 per card. This means that RMS's
marginal costs are $63 per card. Based on recent sales experience, the estimated demand curve and marginal
revenue relations for are:
P
= $130 - $0.000125Q
MR
= TR/ Q = $130 - $0.00025Q
0.00025Q
= 130
Q
= 520,000
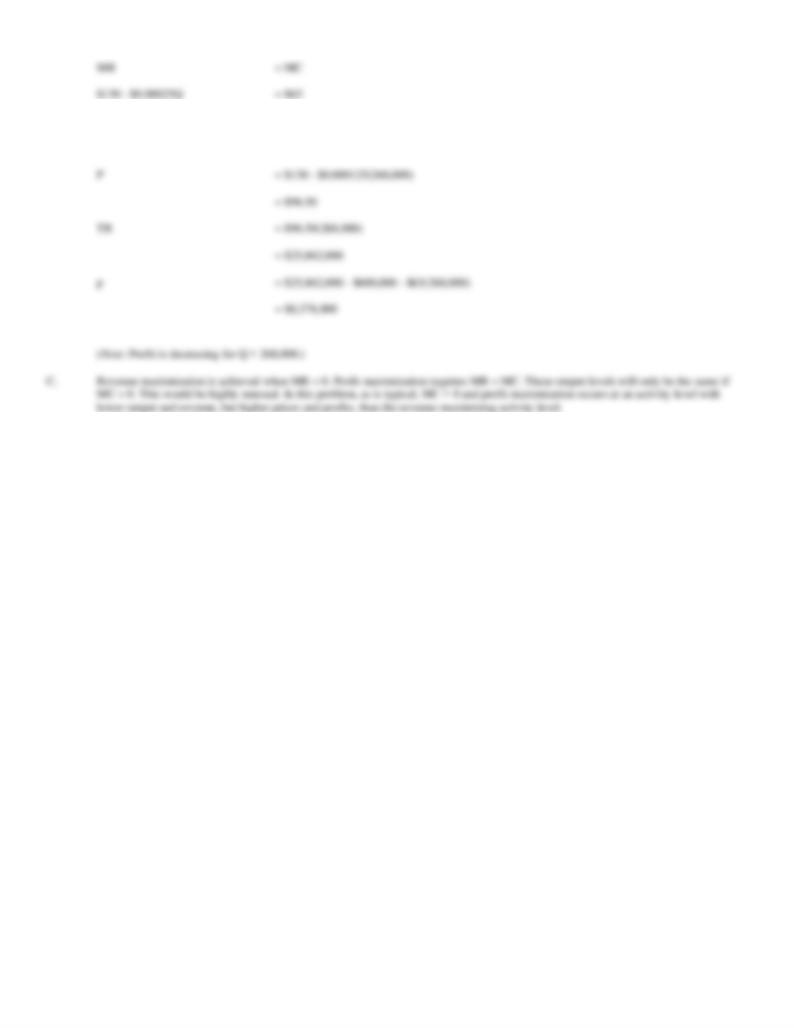
0.00025Q
= 67
Q
= 268,000