CHAPTER 3--DEMAND AND SUPPLY
Student: ___________________________________________________________________________

7. Holding all else equal, an unnecessary increase in federally-mandated auto safety requirements leads to a
8. Holding all else equal, an increase in mandatory payments by employers for universal health care coverage


18. Oil refiners can vary the mix of gasoline versus diesel fuel derived from a barrel of oil. If the price of diesel
23. The equilibrium market price of lead pencils would decrease and the quantity of pencils produced and sold
26. Demand and Supply Curves. The following relations describe demand and supply conditions in the
lumber/forest products industry:
2.50
2.00
1.50
1.00
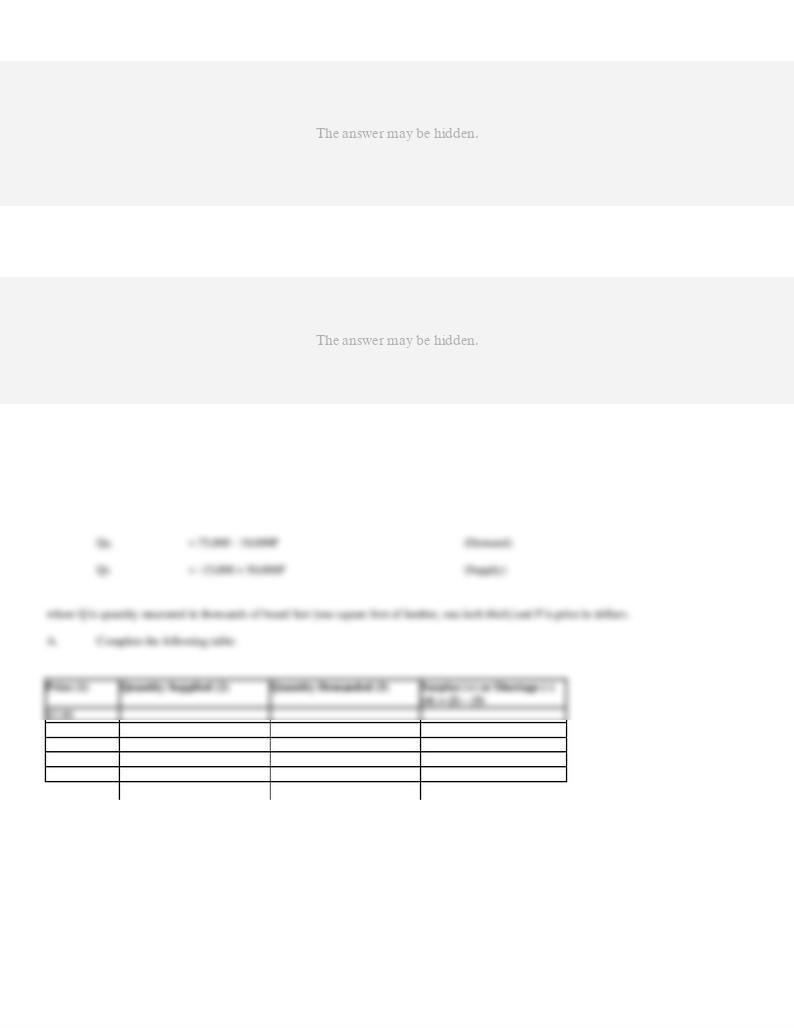
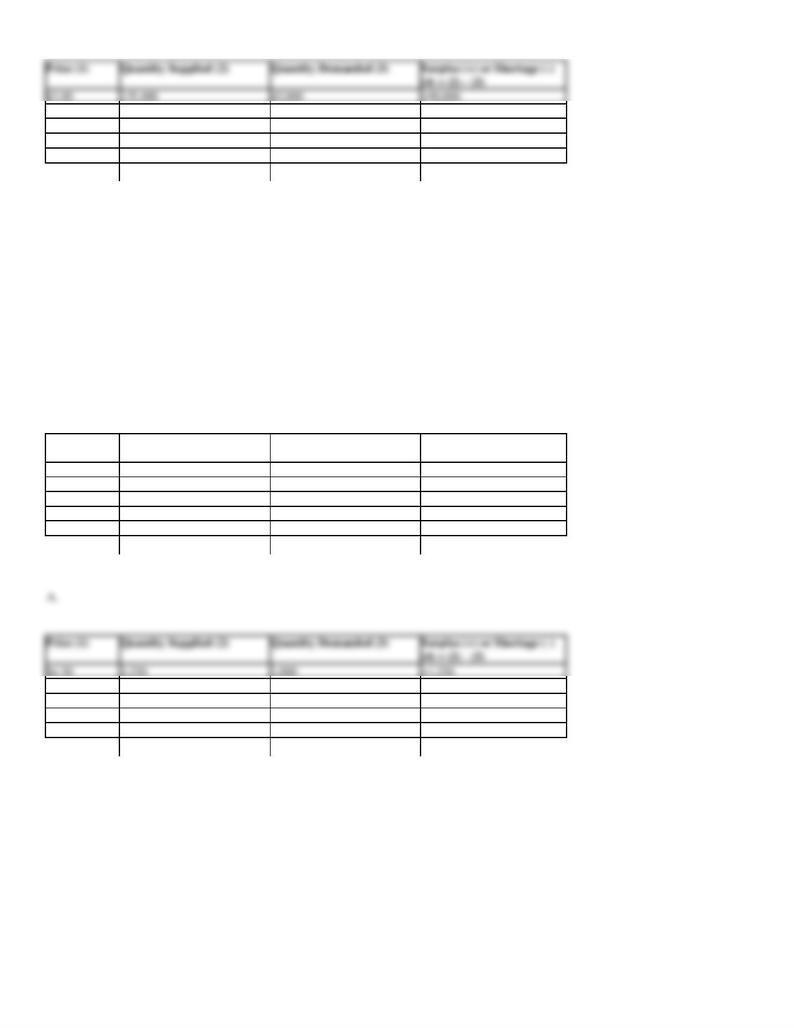
27. Demand and Supply Curves. The following relations describe demand and supply conditions in the wheat
industry:
QD
= 5,500 - 1,000P
(Demand)
QS
= -4,500 + 1,500P
(Supply)
where Q is quantity measured in millions of bushels and P is price in dollars.
A.
Complete the following table:
Price (1)
Quantity Supplied (2)
Quantity Demanded (3)
Surplus (+) or Shortage (-)
(4) = (2) - (3)
$4.50
4.25
4.00
3.75
3.50
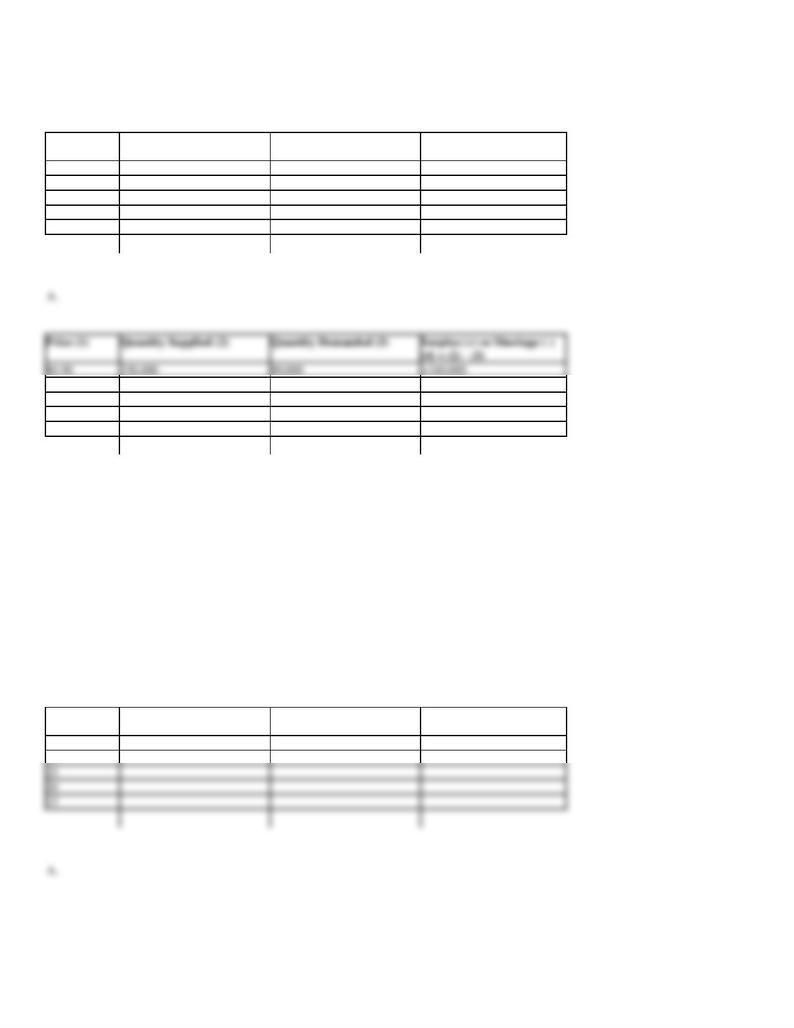
28. Demand and Supply Curves. The following relations describe demand and supply conditions in the milk
industry:
QD
= 315,000 - 250,000P
(Demand)
QS
= -165,000 + 550,000P
(Supply)
where Q is quantity measured in millions of gallons and P is price in dollars.
A.
Complete the following table:
Price (1)
Quantity Supplied (2)
Quantity Demanded (3)
Surplus (+) or Shortage (-)
(4) = (2) - (3)
$0.90
0.80
0.70
0.60
0.50
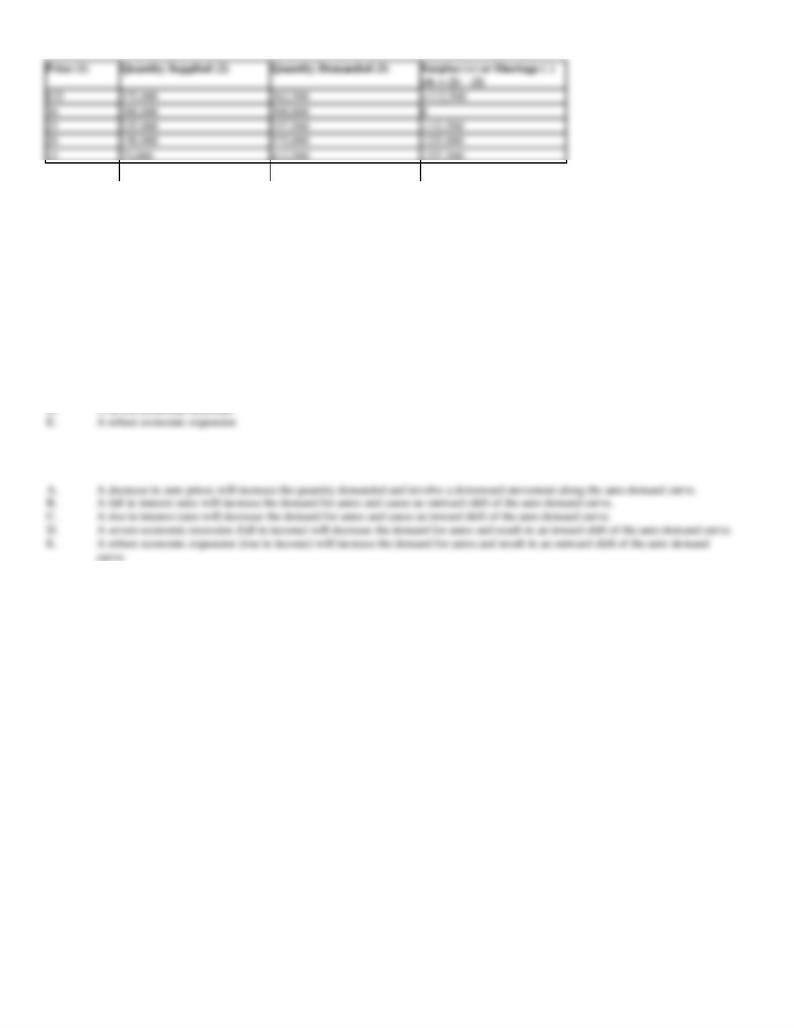
29. Demand and Supply Curves. The following relations describe demand and supply conditions in the oil
industry:
QD
= 525,000 - 7,500P
(Demand)
QS
= -150,000 + 15,000P
(Supply)
where Q is quantity measured in millions of barrels and P is price in dollars.
A.
Complete the following table:

30. Demand Analysis. The demand for automobiles is often described as highly cyclical, and very sensitive to
automobile prices and interest rates. Given these characteristics, describe the effect of each of the following in
terms of whether it would increase or decrease the quantity demanded or the demand for automobiles.
Moreover, when price is expressed as a function of quantity, indicate whether the effect of each of the following
is an upward or downward movement along a given demand curve or instead involves an outward or inward
shift in the relevant demand curve for autos. Explain your answers.
31. Demand Analysis. The demand for refrigerators is often described as cyclical, and very sensitive to
refrigerator prices and interest rates. Given these characteristics, describe the effect of each of the following in
terms of whether it would increase or decrease the quantity demanded or the demand for refrigerators.
Moreover, when price is expressed as a function of quantity, indicate whether the effect of each of the following
is an upward or downward movement along a given demand curve or instead involves an outward or inward
shift in the relevant demand curve for refrigerators. Explain your answers.

32. Demand Analysis. The demand for high-definition television sets (HDTV) is often described as highly
cyclical, and very sensitive to HDTV prices and interest rates. Given these characteristics, describe the effect of
each of the following in terms of whether it would increase or decrease the quantity demanded or the demand of
HDTVs. Moreover, when price is expressed as a function of quantity, indicate whether the effect of each of the
following is an upward or downward movement along a given demand curve or instead involves an outward or
inward shift in the relevant demand curve for HDTVs. Explain your answers.
33. Comparative Statics. Demand and supply conditions in the market for unskilled labor are important
concerns to business and government decision makers. Consider the case of a federally mandated minimum
wage set above the equilibrium or market clearing wage level. Some of the following factors have the potential
to influence the demand or quantity demanded of unskilled labor. Influences on the supply or quantity supplied
may also result. Holding all else equal, describe these influences as increasing or decreasing, and indicate the
direction of the resulting movement along or shift in the relevant curve(s).

34. Comparative Statics. Demand and supply conditions in the steel market are important concerns to business
and government decision makers. Some of the following factors have the potential to influence the demand or
quantity demanded of raw steel. Influences on the supply or quantity supplied may also result. Holding all else
equal, describe these influences as increasing or decreasing, and indicate the direction of the resulting
movement along or shift in the relevant curve(s).
35. Comparative Statics. Demand and supply conditions in the market for utility-generated electric power are
important concerns to business and government decision makers. Some of the following factors have the
potential to influence the demand or quantity demanded of electric power. Influences on the supply or quantity
supplied may also result. Holding all else equal, describe these influences as increasing or decreasing, and
indicate the direction of the resulting movement along or shift in the relevant curve(s).

36. Comparative Statics. Coupon Promotions, Inc., is a coupon book publisher with markets in several
southwestern states. CPI coupon books are sold directly to the public, sold through religious and other
charitable organizations, or given away as promotional items. Operating experience during the past year
suggests the following demand function for its coupon books:
Q = 10,000 - 5,000P + 0.02Pop + 0.4I + 0.6A
where Q is quantity, P is price ($), Pop is population, I is disposable income per capita ($), and A is advertising expenditures ($).
A.
Determine the demand curve faced by CPI in a typical market where P = $5, Pop = 1,000,000 persons, I = $35,000 and A = $10,000.
Show the demand curve with quantity expressed as a function of price, and price expressed as a function of quantity.
B.
Calculate the quantity demanded at prices of $5, $2.50, and $0.
C.
Calculate the prices necessary to sell 10,000, 25,000, and 50,000 units.
37. Quantity Demanded. Gurgling Springs, Inc. is a bottler of natural spring water distributed throughout the
New England states. Five-gallon containers of GSI spring water are regionally promoted and distributed
through grocery chains. Operating experience during the past year suggests the following demand function for
its spring water:
Q = 250 - 100P + 0.0001Pop + 0.003I + 0.003A
where Q is quantity in thousands of five-gallon containers, P is price ($), Pop is population, I is disposable income per capita ($), and A is advertising
expenditures ($).
A.
Determine the demand curve faced by CPI in a typical market where P = $4, Pop = 4,000,000 persons, I = $50,000 and A = $400,000.
Show the demand curve with quantity expressed as a function of price, and price expressed as a function of quantity.
B.
Calculate the quantity demanded at prices of $5, $4, and $3.
C.
Calculate the prices necessary to sell 1,250, 1,500, and 1,750 thousands of five-gallon containers.

38. Quantity Demanded. The Sharper Edge, Inc. is a leading retailer of Yingsu Knives, a set of kitchen cutlery,
which it markets on a nationwide basis. SEI knife sets are either sold directly to the public through national
television marketing programs, or given away as promotional items. Operating experience during the past year
suggests the following demand function for its knife sets:
Q = 4,000 - 4,000P + 10,000N + 0.25I + 0.4A
Where Q is quantity, P is the price ($), N is the average Nielson rating of television programs during which SEI advertises Yingsu Knives, I is
average disposable income per household ($), and A is advertising expenditures ($).
A.
Determine the demand curve faced by SEI in a typical market where P = $35, N = 18.5, I = $44,000, and A = $500,000. Show the
demand curve with quantity expressed as a function of price, and price expressed as a function of quantity.
B.
Calculate the quantity demanded at prices of $40, $35, and $30.
C.
Calculate the prices necessary to sell 264,000, 292,000, and 320,000 sets of knives.
39. Demand Curve Analysis. Air California, Inc. is a regional airline providing service between Los Angeles,
California and Las Vegas, Nevada. An analysis of the monthly demand for service has revealed the following
demand relation:
Q = 45,000 - 250P - 300PC + 250BAI + 10,000S
Where Q is quantity measured by the number of passengers per month, P is the price ($), PC is a price index for connecting flights (1982 = 100.), BAI
is a business activity index (1982 = 100) and S, a binary or dummy variable, equals 1 in summer months, zero otherwise.
A.
Determine the demand curve facing the airline during the winter month of January if P = $100, PC = 150, BAI = 200, and S = 0.
B.
Calculate the quantity demanded and total revenues during the summer month of July if all price-related variables are as specified
above.

40. Demand Curve Analysis. The Badger Bus Company is a regional bus line providing service between
Milwaukee, Wisconsin and Chicago, Illinois. An analysis of the monthly demand for service has revealed the
following demand relation:
Q = 1,750 - 40P - 15PC + 30BAI - 1,700S
Where Q is quantity measured by the number of passengers per month, P is the price ($), PC is a price index for connecting bus routes (1992 = 100.),
BAI is a business activity index (1992 = 100) and S, a binary or dummy variable, equals 1 in summer months, zero otherwise.
A.
Determine the demand curve facing the bus service during the winter month of February if P = $40, PC = 120, BAI = 175, and S = 0.
B.
Calculate the quantity demanded and total revenues during the summer month of August if all price-related variables are as specified
above.
41. Demand Curve Analysis. Papa's Pizza, Ltd., provides delivery and carryout service to the city of South
Bend, Indiana. An analysis of the daily demand for pizzas has revealed the following demand relation:
Q = 1,400 - 100P - 2PS + 0.01CSP + 750S
where Q is the quantity measured by the number of pizzas per day, P is the price ($), PS is a price index for soda pop (1992 = 100), CSP is the college
student population and S, a binary or dummy variable, equals 1 on Friday, Saturday and Sunday, zero otherwise.
A.
Determine the demand curve facing Papa's Pizza on Tuesdays if P = $10, PS = 125, and CSP = 35,000, and S = 0.
B.
Calculate the quantity demanded and total revenues on Fridays if all price-related variables are as specified above.
42. Supply Curve Analysis. A review of industry-wide data for the domestic wine manufacturing industry
suggests the following industry supply function:
Q
= -7,000,000 + 400,000P - 2,000,000PL - 1,500,000P K + 1,000,000W

where Q is cases supplied per year, P is the wholesale price per case ($), PL is the average price paid for unskilled labor ($), PK is the average price of
capital (in percent), and W is weather measured by the average seasonal rainfall in growing areas (in inches).
A.
Determine the industry supply curve for a recent year when P = $80, PL = $10, PK = 12%, and W = 25 inches of rainfall. Show the
industry supply curve with quantity expressed as a function of price and price expressed as a function of quantity.
B.
Calculate the quantity supplied by the industry at prices of $50, $75 and $100 per case.
C.
Calculate the prices necessary to generate a supply of 10 million, 25 million, and 50 million cases.
43. Supply Curve Analysis. A review of industry-wide data for the frozen grape juice manufacturing industry
suggests the following industry supply function:
Q
= -3,000,000 + 500,000P - 800,000PL - 1,000,000PK + 300,000W
where Q is cases supplied per year, P is the wholesale price per case ($), PL is the average price paid for unskilled labor ($), PK is the average price of
capital (in percent), and W is weather measured by the average seasonal temperature in growing areas (in Fahrenheit).
A.
Determine the industry supply curve for a recent year when P = $40, PL = $10, PK = 15%, and W = 70 degrees Fahrenheit. Show the
industry supply curve with quantity expressed as a function of price and price expressed as a function of quantity.
B.
Calculate the quantity supplied by the industry at prices of $30, $40 and $50 per case.
C.
Calculate the prices necessary to generate a supply of 10 million, 25 million, and 40 million cases.
44. Supply Curve Analysis. Computers.com is a leading Internet retailer of high-performance desktop
computers. Based on an analysis of monthly cost and output data, the company has estimated the following
relation between its marginal cost of production and monthly output:
MC = ¶ TC/ ¶ Q = $100 + $0.005Q

A.
Calculate the marginal cost of production at 100,000, 200,000, and 300,000 units of output.
B.
Express output as a function of marginal cost. Calculate the level of output at which MC = $1,000, $1,500 and $2,000.
C.
Calculate the profit-maximizing level of output if prices are stable in the industry at $1,500 per unit and, therefore, P = MR = $1,500.
D.
Again assuming prices are stable in the industry, derive the firm's supply curve. Express price as a function of quantity and quantity as a
function of price.
45. Supply Curve Analysis. Credible Switches, Inc., is a distributor of generic safety switches used in the
washing machines and dryers. Based on an analysis of monthly cost and output data, the company has estimated
the following relation between the marginal cost (wholesale cost plus distribution cost per unit) and monthly
output:
MC = TC/ Q = $2 + $0.00001Q
A.
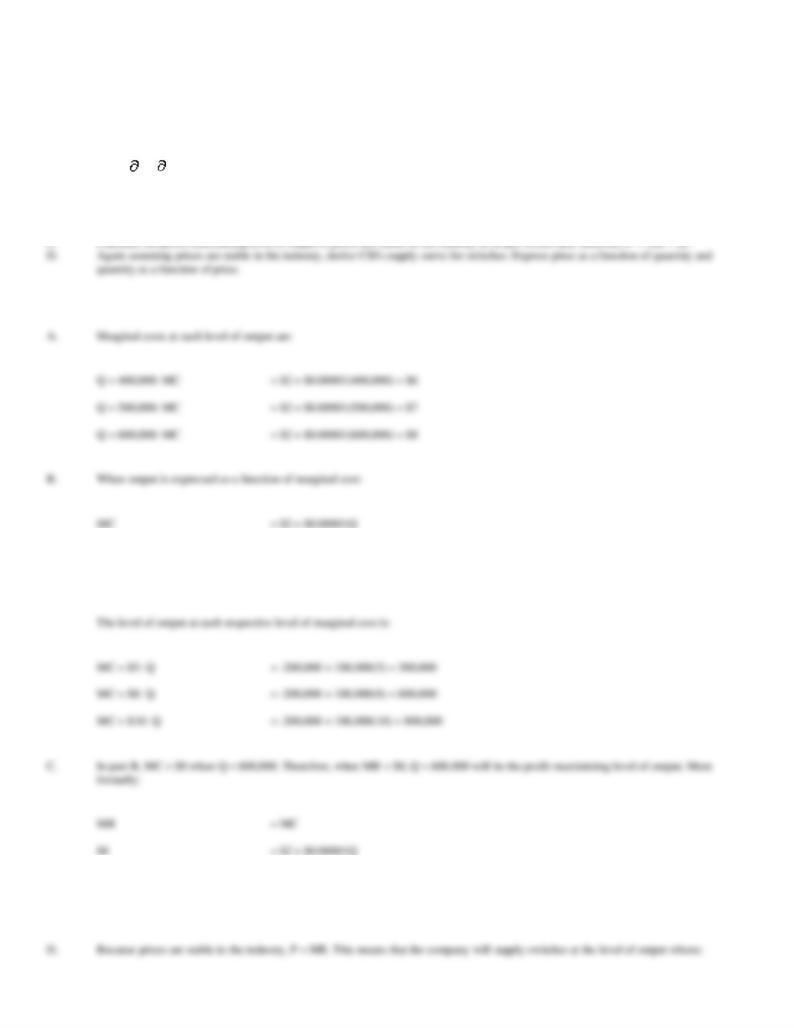
Calculate marginal cost at 400,000, 500,000, and 600,000 units of output.
B.
Express output as a function of marginal cost. Calculate the level of output at which MC = $5, $8, and $10.
C.
Calculate the profit-maximizing level of output if prices are stable in the industry at $8 per switch and, therefore, P = MR = $8.
D.
Again assuming prices are stable in the industry, derive CSI's supply curve for switches. Express price as a function of quantity and
quantity as a function of price.
46. Optimal Supply. Shake-n-Shing, Inc., is a supplier of wood shakes and shingles used in home construction.
Shakes and shingles are sold by the bundle. Based on an analysis of monthly cost and output data, the company
has estimated the following relation between its marginal costs and monthly output:
MC = TC/ Q = $50 + $0.00005Q
A.
Calculate marginal cost at 500,000, 700,000, and 900,000 bundles of output.
B.
Express output as a function of marginal cost. Calculate the level of output at which MC = $75, $100 and $125.
C.
Calculate the profit-maximizing level of output if prices are stable in the industry at $100 per bundle, and, therefore, P = MR = $100.
D.
Again assuming prices are stable in the industry, derive Shake-n-Shing's supply curve for bundles of shakes and shingles. Express price
as a function of quantity and quantity as a function of price.
47. Industry Supply. Columbia Pharmaceuticals, Inc., and Princeton Medical, Ltd., supply a generic drug
equivalent of an antibiotic used to treat postoperative infections. Proprietary cost and output information for
each company reveal the following relations between marginal cost and output:
MCC
= TCC/ Q = $5 + $0.001QC
(Columbia)
MCP
= TCP/ Q = $6 + $0.00025QP
(Princeton)
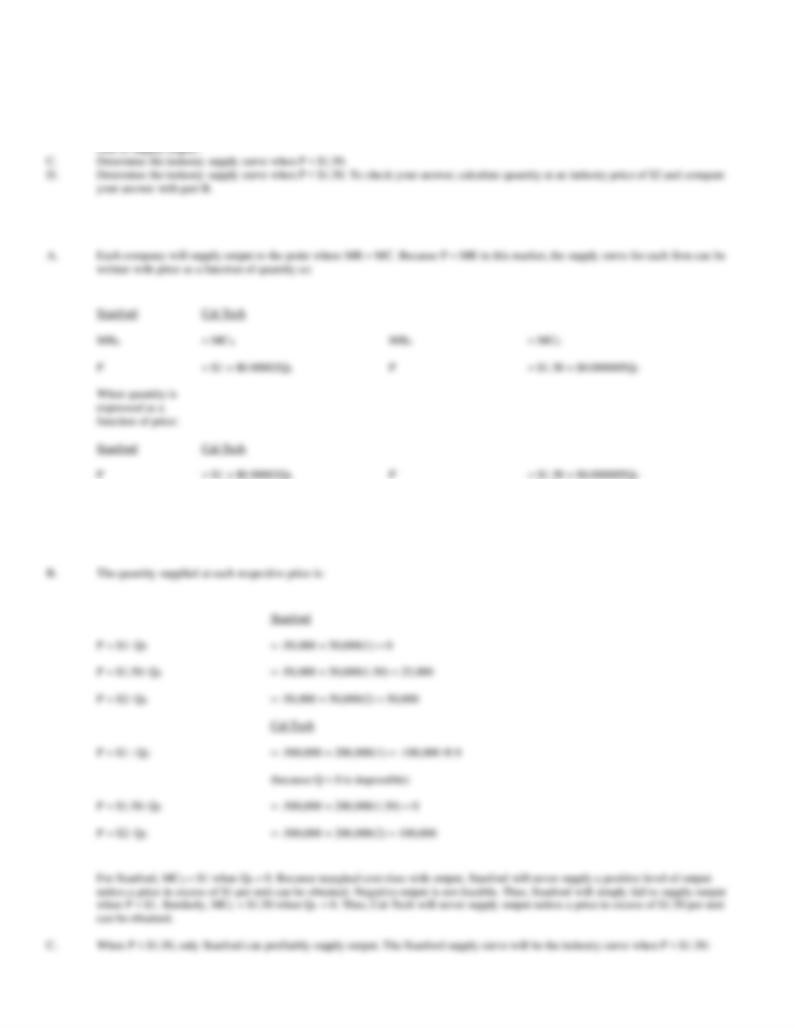
48. Industry Supply. Stanford Plastics, Inc. and Cal-Tech Associates, Inc. supply a generic phone jack that
connects telephone cords to phone outlets. Proprietary cost and output information for each company reveal the
following relations between marginal cost and output:
MCS
= TCS/ Q = $1 + $0.00002QS
(Stanford)
MCC
= TCC/ Q = $1.50 + $0.000005QC
(Cal-Tech)
49. Market Equilibrium. Florida Orange Juice is a product of Florida's Orange Growers' Association. Demand
and supply of the product are both highly sensitive to changes in the weather. During hot summer months,
demand for orange juice and other beverages grows rapidly. On the other hand, hot dry weather has an adverse
effect on supply by reducing the size of the orange crop.
Demand and supply functions for Florida orange juice are as follows:
QD
= 4,500,000 - 1,200,000P + 2,000,000PS
+ 1,500Y + 100,000T
(Demand)

50. Market Equilibrium. Various beverages are sold by roving vendors at Busch Stadium, home of the St.
Louis Cardinals. Demand and supply of the product are both highly sensitive to changes in the weather. During
hot summer months, demand for ice-cold beverages grows rapidly. On the other hand, hot dry weather has an
adverse effect on supply in that it taxes the stamina of the vendor carrying his or her goods up and down many
flights of stairs. The only competition for this service is provided by the beverages that can be purchased at
kiosks located throughout the stadium.
Demand and supply functions for ice-cold beverages per game are as follows:
QD
= 20,000 - 20,000P + 7,500PK + 0.8Y + 500T
(Demand)
QS
= 1,000 + 12,000P - 900PL - 1,000PC - 200T
(Supply)
where P is the average price of ice-cold beverage ($ per beverage), PK is the average price of beverages sold at the kiosks ($ per beverage), Y is
disposable income per household for baseball fans, T is the average daily high temperature (degrees), PL is the average price of unskilled labor ($ per
hour), and PC is the average cost of capital (in percent).

CHAPTER 3--DEMAND AND SUPPLY Key
7. Holding all else equal, an unnecessary increase in federally-mandated auto safety requirements leads to a
8. Holding all else equal, an increase in mandatory payments by employers for universal health care coverage

18. Oil refiners can vary the mix of gasoline versus diesel fuel derived from a barrel of oil. If the price of diesel
23. The equilibrium market price of lead pencils would decrease and the quantity of pencils produced and sold

26. Demand and Supply Curves. The following relations describe demand and supply conditions in the
lumber/forest products industry:
2.50
2.00
1.50
1.00
A.
2.50
110,000
50,000
+60,000
2.00
85,000
55,000
+30,000
1.50
60,000
60,000
0
1.00
35,000
65,000
-30,000
27. Demand and Supply Curves. The following relations describe demand and supply conditions in the wheat
industry:
QD
= 5,500 - 1,000P
(Demand)
QS
= -4,500 + 1,500P
(Supply)
where Q is quantity measured in millions of bushels and P is price in dollars.
A.
Complete the following table:
Price (1)
Quantity Supplied (2)
Quantity Demanded (3)
Surplus (+) or Shortage (-)
(4) = (2) - (3)
$4.50
4.25
4.00
3.75
3.50
4.25
1,875
1,250
+625
4.00
1,500
1,500
0
3.75
1,125
1,750
-625
3.50
750
2,000
-1,250
28. Demand and Supply Curves. The following relations describe demand and supply conditions in the milk
industry:
QD
= 315,000 - 250,000P
(Demand)
QS
= -165,000 + 550,000P
(Supply)
where Q is quantity measured in millions of gallons and P is price in dollars.
A.
Complete the following table:
Price (1)
Quantity Supplied (2)
Quantity Demanded (3)
Surplus (+) or Shortage (-)
(4) = (2) - (3)
$0.90
0.80
0.70
0.60
0.50
0.80
275,000
115,000
+160,000
0.70
220,000
140,000
+80,000
0.60
165,000
165,000
0
0.50
110,000
190,000
-80,000
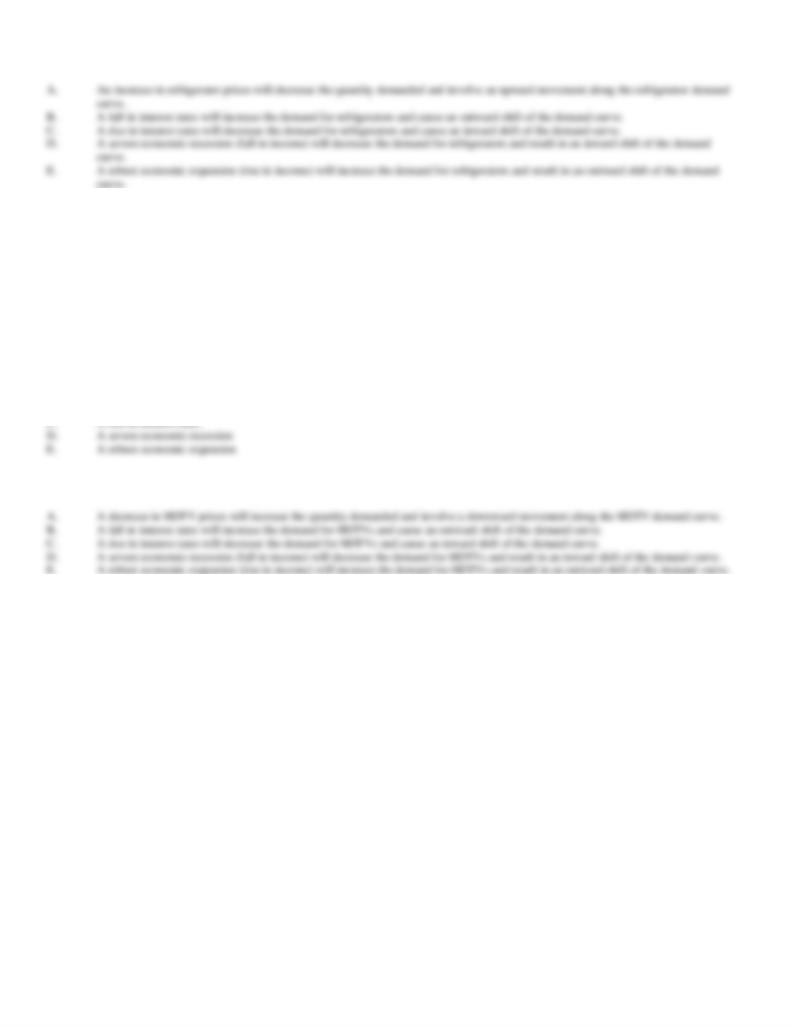
29. Demand and Supply Curves. The following relations describe demand and supply conditions in the oil
industry:
QD
= 525,000 - 7,500P
(Demand)
QS
= -150,000 + 15,000P
(Supply)
where Q is quantity measured in millions of barrels and P is price in dollars.
A.
Complete the following table:
Price (1)
Quantity Supplied (2)
Quantity Demanded (3)
Surplus (+) or Shortage (-)
(4) = (2) - (3)
$35
30
30. Demand Analysis. The demand for automobiles is often described as highly cyclical, and very sensitive to
automobile prices and interest rates. Given these characteristics, describe the effect of each of the following in
terms of whether it would increase or decrease the quantity demanded or the demand for automobiles.
Moreover, when price is expressed as a function of quantity, indicate whether the effect of each of the following
is an upward or downward movement along a given demand curve or instead involves an outward or inward
shift in the relevant demand curve for autos. Explain your answers.
A.
A decrease in auto prices
B.
A fall in interest rates
C.
A rise in interest rates
31. Demand Analysis. The demand for refrigerators is often described as cyclical, and very sensitive to
refrigerator prices and interest rates. Given these characteristics, describe the effect of each of the following in
terms of whether it would increase or decrease the quantity demanded or the demand for refrigerators.
Moreover, when price is expressed as a function of quantity, indicate whether the effect of each of the following
is an upward or downward movement along a given demand curve or instead involves an outward or inward
shift in the relevant demand curve for refrigerators. Explain your answers.
A.
An increase in refrigerator prices
B.
A fall in interest rates
C.
A rise in interest rates
D.
A severe economic recession
E.
A robust economic expansion
32. Demand Analysis. The demand for high-definition television sets (HDTV) is often described as highly
cyclical, and very sensitive to HDTV prices and interest rates. Given these characteristics, describe the effect of
each of the following in terms of whether it would increase or decrease the quantity demanded or the demand of
HDTVs. Moreover, when price is expressed as a function of quantity, indicate whether the effect of each of the
following is an upward or downward movement along a given demand curve or instead involves an outward or
inward shift in the relevant demand curve for HDTVs. Explain your answers.
A.
A decrease in HDTV prices
B.
A fall in interest rates
33. Comparative Statics. Demand and supply conditions in the market for unskilled labor are important
concerns to business and government decision makers. Consider the case of a federally mandated minimum
wage set above the equilibrium or market clearing wage level. Some of the following factors have the potential
to influence the demand or quantity demanded of unskilled labor. Influences on the supply or quantity supplied
may also result. Holding all else equal, describe these influences as increasing or decreasing, and indicate the
direction of the resulting movement along or shift in the relevant curve(s).
A.
An increase in the popularity of self-service gas stations, car washes, and so on.
B.
A fall in welfare benefits
C.
An increase in the minimum wage
D.
A rise in interest rates
E.
A decrease in the quality of secondary education
A.
"Self-service" gas stations, car washes, and so on, involve a substitution of the consumer's own labor for hired unskilled labor. As
34. Comparative Statics. Demand and supply conditions in the steel market are important concerns to business
and government decision makers. Some of the following factors have the potential to influence the demand or
quantity demanded of raw steel. Influences on the supply or quantity supplied may also result. Holding all else
equal, describe these influences as increasing or decreasing, and indicate the direction of the resulting
movement along or shift in the relevant curve(s).
A.
Increases in the U. S. Department of Transportation's mileage requirements for car fleets.
B.
Public outcry at the poor condition of the nation's interstate freeway system.
C.
New alloys that increase steel's tensile strength are created.
D.
A severe recession.
E.
A new technology reduces the production cost of raw steel by one-third.
A.
An increase in the U. S. DOT's minimum mileage requirement for the auto maker's fleets would incite auto manufacturers to substitute
lighter materials for steel (e.g., plastics, high-temperature ceramics) in order to build the cars lighter, and hence, more fuel-efficient. The
35. Comparative Statics. Demand and supply conditions in the market for utility-generated electric power are
important concerns to business and government decision makers. Some of the following factors have the
potential to influence the demand or quantity demanded of electric power. Influences on the supply or quantity
supplied may also result. Holding all else equal, describe these influences as increasing or decreasing, and
indicate the direction of the resulting movement along or shift in the relevant curve(s).
A.
An increase in the strategic desirability for large manufacturers to co-generate (or self-generate) power.
B.
Congress mandates reduced emissions from coal combustion.
C.
Environmentalist groups spark a conservation effort nationwide.
D.
A health study finds a positive correlation between number of hours under a heat lamp and reduced risk of cancer.
E.
An advance in solar technology creates very efficient collection devices, allowing for cheap and efficient roof-top solar energy.
36. Comparative Statics. Coupon Promotions, Inc., is a coupon book publisher with markets in several
southwestern states. CPI coupon books are sold directly to the public, sold through religious and other
charitable organizations, or given away as promotional items. Operating experience during the past year
suggests the following demand function for its coupon books:
Q = 10,000 - 5,000P + 0.02Pop + 0.4I + 0.6A
where Q is quantity, P is price ($), Pop is population, I is disposable income per capita ($), and A is advertising expenditures ($).
A.
Determine the demand curve faced by CPI in a typical market where P = $5, Pop = 1,000,000 persons, I = $35,000 and A = $10,000.
Show the demand curve with quantity expressed as a function of price, and price expressed as a function of quantity.
B.
Calculate the quantity demanded at prices of $5, $2.50, and $0.
C.
Calculate the prices necessary to sell 10,000, 25,000, and 50,000 units.
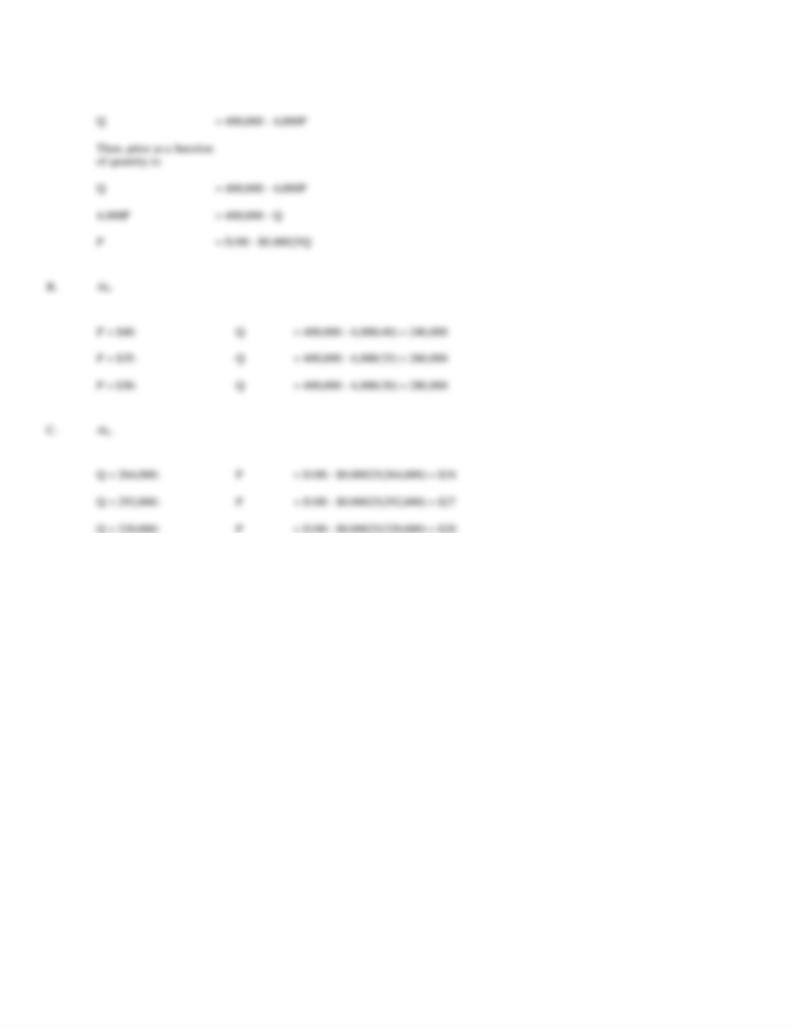
A.
The value for each respective non-price variable must be substituted into the demand function in order to derive the relevant demand
curve:
Q
= 10,000 - 5,000P + 0.02Pop + 0.4I + 0.6A
= 10,000 - 5,000P + 0.02(1,000,000) + 0.4(35,000) + 0.6(10,000)
37. Quantity Demanded. Gurgling Springs, Inc. is a bottler of natural spring water distributed throughout the
New England states. Five-gallon containers of GSI spring water are regionally promoted and distributed
through grocery chains. Operating experience during the past year suggests the following demand function for
its spring water:
Q = 250 - 100P + 0.0001Pop + 0.003I + 0.003A
where Q is quantity in thousands of five-gallon containers, P is price ($), Pop is population, I is disposable income per capita ($), and A is advertising
expenditures ($).
A.
Determine the demand curve faced by CPI in a typical market where P = $4, Pop = 4,000,000 persons, I = $50,000 and A = $400,000.
Show the demand curve with quantity expressed as a function of price, and price expressed as a function of quantity.
B.
Calculate the quantity demanded at prices of $5, $4, and $3.
C.
Calculate the prices necessary to sell 1,250, 1,500, and 1,750 thousands of five-gallon containers.
A.
The value for each respective non-price variable must be substituted into the demand function in order to derive the relevant demand
curve:
Q
= 250 - 100P + 0.0001Pop + 0.005I + 0.003A
38. Quantity Demanded. The Sharper Edge, Inc. is a leading retailer of Yingsu Knives, a set of kitchen cutlery,
which it markets on a nationwide basis. SEI knife sets are either sold directly to the public through national
television marketing programs, or given away as promotional items. Operating experience during the past year
suggests the following demand function for its knife sets:
Q = 4,000 - 4,000P + 10,000N + 0.25I + 0.4A
Where Q is quantity, P is the price ($), N is the average Nielson rating of television programs during which SEI advertises Yingsu Knives, I is
average disposable income per household ($), and A is advertising expenditures ($).
A.
Determine the demand curve faced by SEI in a typical market where P = $35, N = 18.5, I = $44,000, and A = $500,000. Show the
demand curve with quantity expressed as a function of price, and price expressed as a function of quantity.
B.
Calculate the quantity demanded at prices of $40, $35, and $30.
C.
Calculate the prices necessary to sell 264,000, 292,000, and 320,000 sets of knives.
A.
The value for each respective non-price variable must be substituted into the demand function in order to derive the relevant demand
curve:
Q
= 4,000 - 4,000P + 10,000N + 0.25I + 0.4A
= 4,000 - 4,000P + 10,000(18.5) + 0.25(44,000) + 0.4(500,000)
39. Demand Curve Analysis. Air California, Inc. is a regional airline providing service between Los Angeles,
California and Las Vegas, Nevada. An analysis of the monthly demand for service has revealed the following
demand relation:
Q = 45,000 - 250P - 300PC + 250BAI + 10,000S
Where Q is quantity measured by the number of passengers per month, P is the price ($), PC is a price index for connecting flights (1982 = 100.), BAI
is a business activity index (1982 = 100) and S, a binary or dummy variable, equals 1 in summer months, zero otherwise.
A.
Determine the demand curve facing the airline during the winter month of January if P = $100, PC = 150, BAI = 200, and S = 0.
B.
Calculate the quantity demanded and total revenues during the summer month of July if all price-related variables are as specified
above.
A.
The demand curve facing Air California during January can be calculated by substituting the appropriate value for each respective
variable into the firm's demand function:
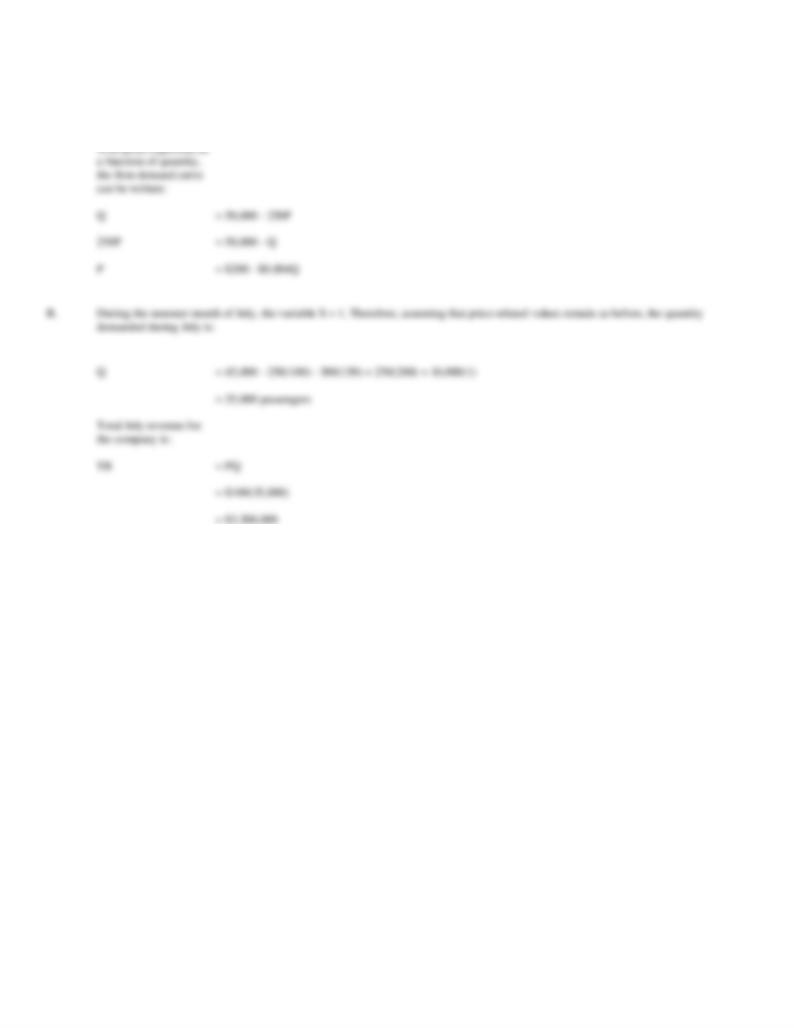
Q
= 45,000 - 250P - 300PC + 250BAI + 10,000S
= 45,000 - 250P - 300(150) + 250(200) + 10,000(0)
Q
= 50,000 - 250P
40. Demand Curve Analysis. The Badger Bus Company is a regional bus line providing service between
Milwaukee, Wisconsin and Chicago, Illinois. An analysis of the monthly demand for service has revealed the
following demand relation:
Q = 1,750 - 40P - 15PC + 30BAI - 1,700S
Where Q is quantity measured by the number of passengers per month, P is the price ($), PC is a price index for connecting bus routes (1992 = 100.),
BAI is a business activity index (1992 = 100) and S, a binary or dummy variable, equals 1 in summer months, zero otherwise.
A.
Determine the demand curve facing the bus service during the winter month of February if P = $40, PC = 120, BAI = 175, and S = 0.
B.
Calculate the quantity demanded and total revenues during the summer month of August if all price-related variables are as specified
above.
A.
The demand curve facing Badger Bus Company during February can be calculated by substituting the appropriate value for each
respective variable into the firm's demand function:
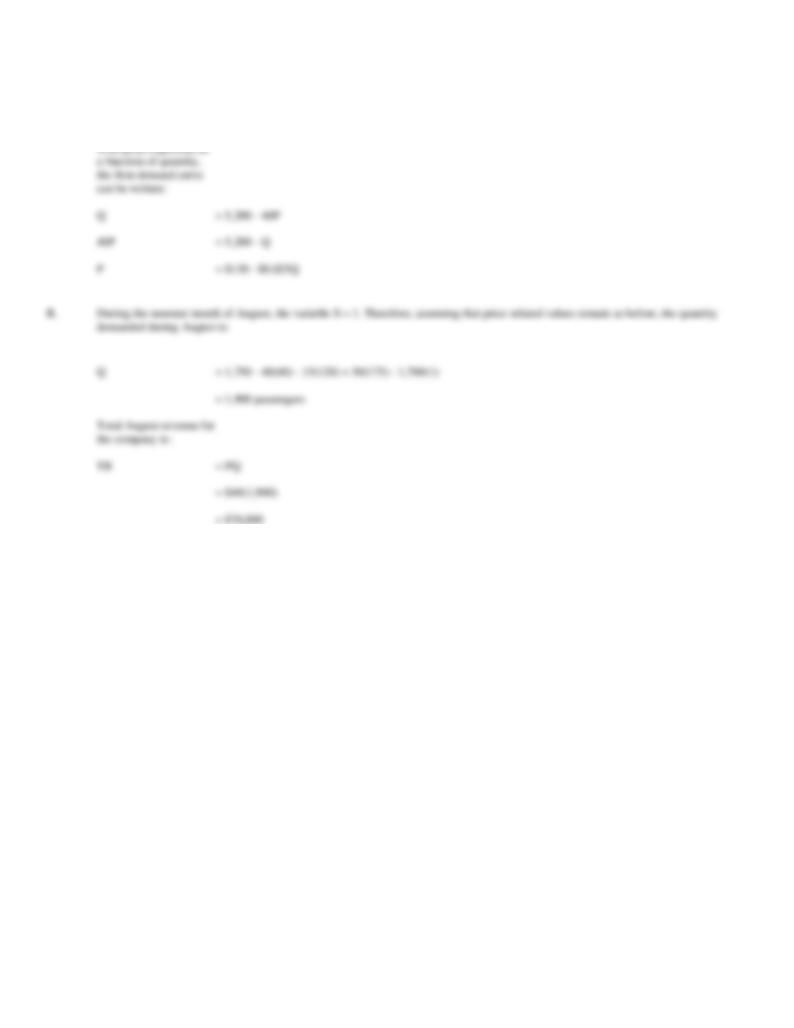
Q
= 1,750 - 40P - 15PC + 30BAI - 1,700S
= 1,750 - 40P - 15(120) + 30(175) - 1,700(0)
Q
= 5,200 - 40P
41. Demand Curve Analysis. Papa's Pizza, Ltd., provides delivery and carryout service to the city of South
Bend, Indiana. An analysis of the daily demand for pizzas has revealed the following demand relation:
Q = 1,400 - 100P - 2PS + 0.01CSP + 750S
where Q is the quantity measured by the number of pizzas per day, P is the price ($), PS is a price index for soda pop (1992 = 100), CSP is the college
student population and S, a binary or dummy variable, equals 1 on Friday, Saturday and Sunday, zero otherwise.
A.
Determine the demand curve facing Papa's Pizza on Tuesdays if P = $10, PS = 125, and CSP = 35,000, and S = 0.
B.
Calculate the quantity demanded and total revenues on Fridays if all price-related variables are as specified above.
A.
The demand curve facing Papa's Pizza on Tuesdays can be calculated by substituting the appropriate value for each respective variable
into the firm's demand function:
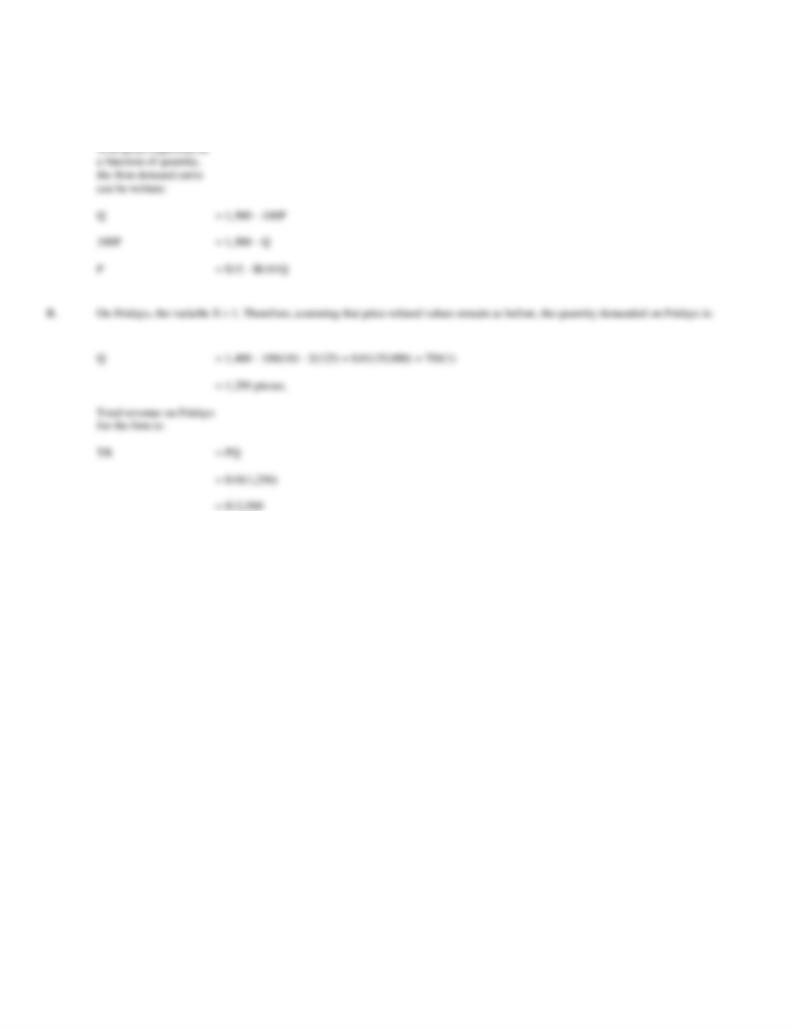
Q
= 1,400 - 100P - 2PS + 0.01CSP + 750S
= 1,400 - 100P - 2(125) + 0.01(35,000) + 750(0)
Q
= 1,500 - 100P
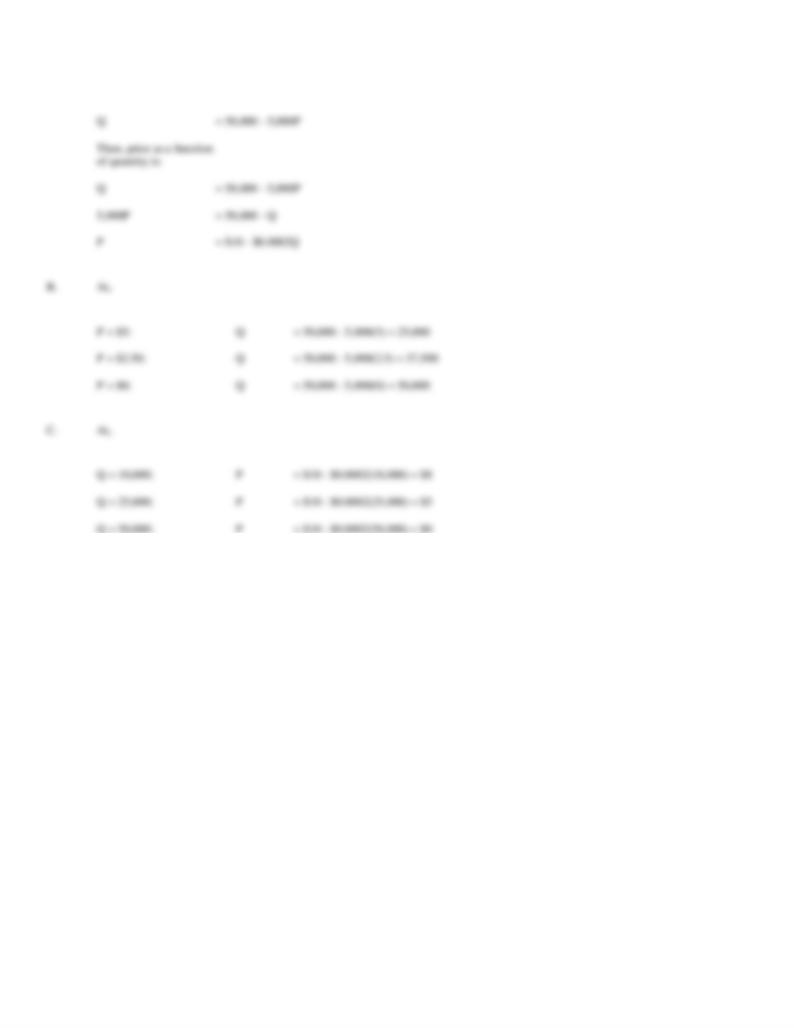
42. Supply Curve Analysis. A review of industry-wide data for the domestic wine manufacturing industry
suggests the following industry supply function:
Q
= -7,000,000 + 400,000P - 2,000,000PL - 1,500,000P K + 1,000,000W
where Q is cases supplied per year, P is the wholesale price per case ($), PL is the average price paid for unskilled labor ($), PK is the average price of
capital (in percent), and W is weather measured by the average seasonal rainfall in growing areas (in inches).
A.
Determine the industry supply curve for a recent year when P = $80, PL = $10, PK = 12%, and W = 25 inches of rainfall. Show the
industry supply curve with quantity expressed as a function of price and price expressed as a function of quantity.
B.
Calculate the quantity supplied by the industry at prices of $50, $75 and $100 per case.
C.
Calculate the prices necessary to generate a supply of 10 million, 25 million, and 50 million cases.
A.
With quantity expressed as a function of price, the industry supply curve can be written:
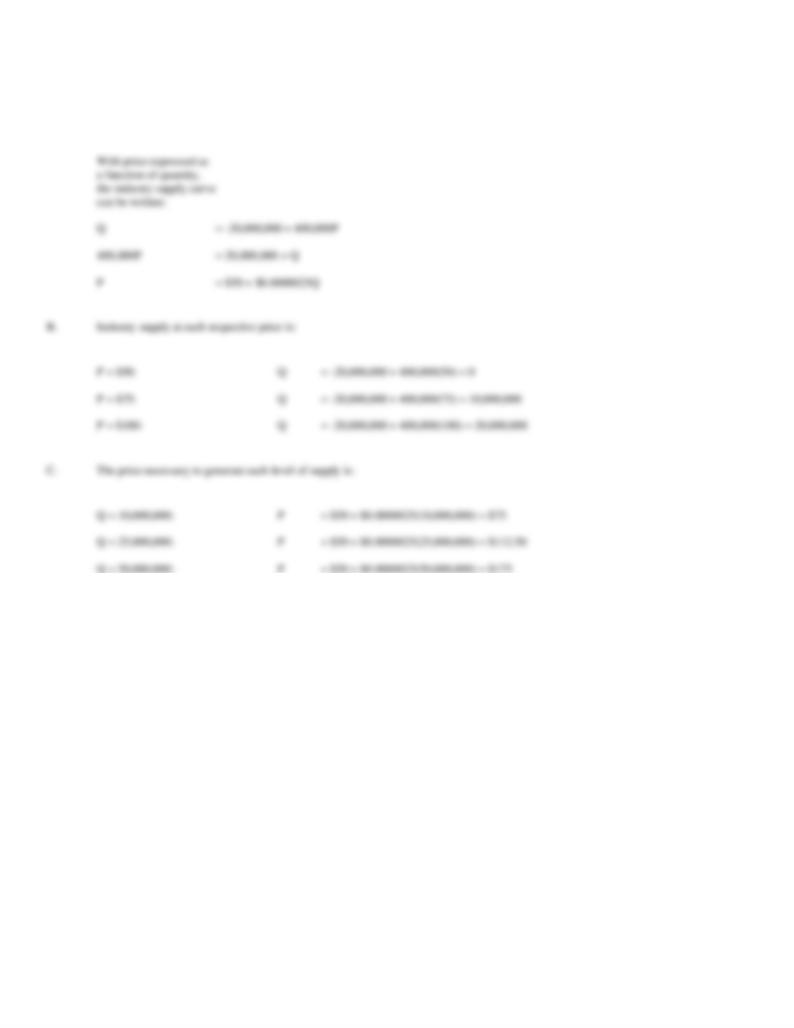
Q
= -7,000,000 + 400,000P - 2,000,000PL - 1,500,000PK + 1,000,000W
= -7,000,000 + 400,000P - 2,000,000(10) - 1,500,000(12)
+ 1,000,000(25)
= -20,000,000 + 400,000P
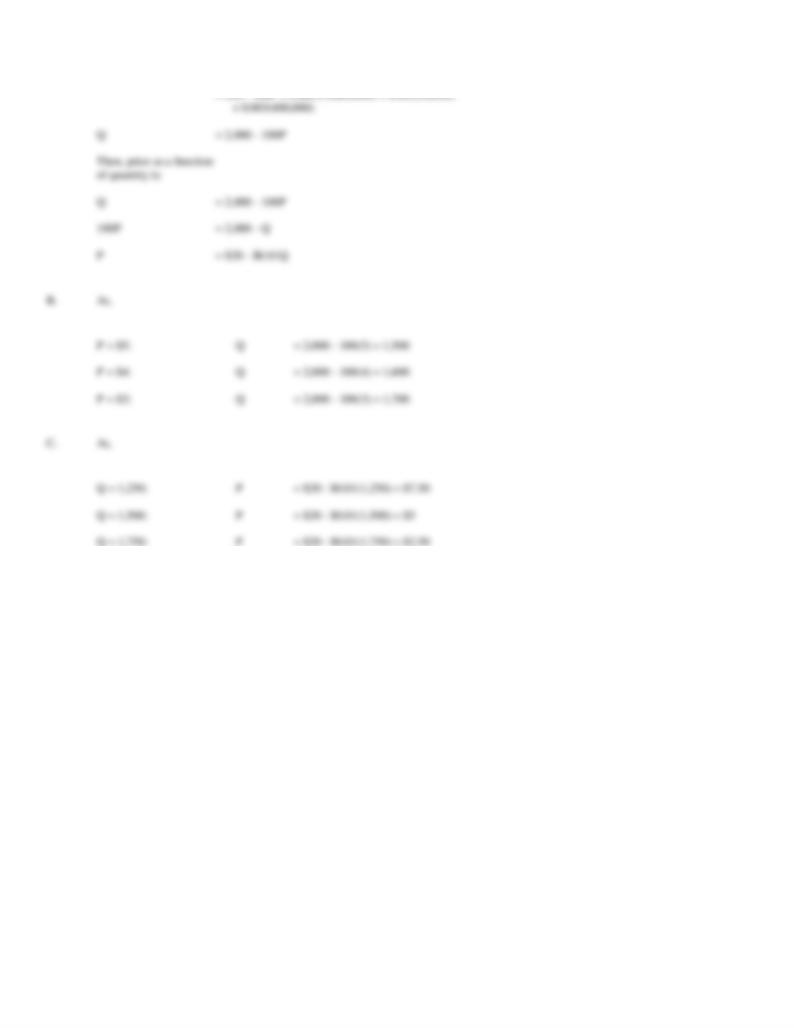
43. Supply Curve Analysis. A review of industry-wide data for the frozen grape juice manufacturing industry
suggests the following industry supply function:
Q
= -3,000,000 + 500,000P - 800,000PL - 1,000,000PK + 300,000W
where Q is cases supplied per year, P is the wholesale price per case ($), PL is the average price paid for unskilled labor ($), PK is the average price of
capital (in percent), and W is weather measured by the average seasonal temperature in growing areas (in Fahrenheit).
A.
Determine the industry supply curve for a recent year when P = $40, PL = $10, PK = 15%, and W = 70 degrees Fahrenheit. Show the
industry supply curve with quantity expressed as a function of price and price expressed as a function of quantity.
B.
Calculate the quantity supplied by the industry at prices of $30, $40 and $50 per case.
C.
Calculate the prices necessary to generate a supply of 10 million, 25 million, and 40 million cases.
A.
With quantity expressed as a function of price, the industry supply curve can be written:
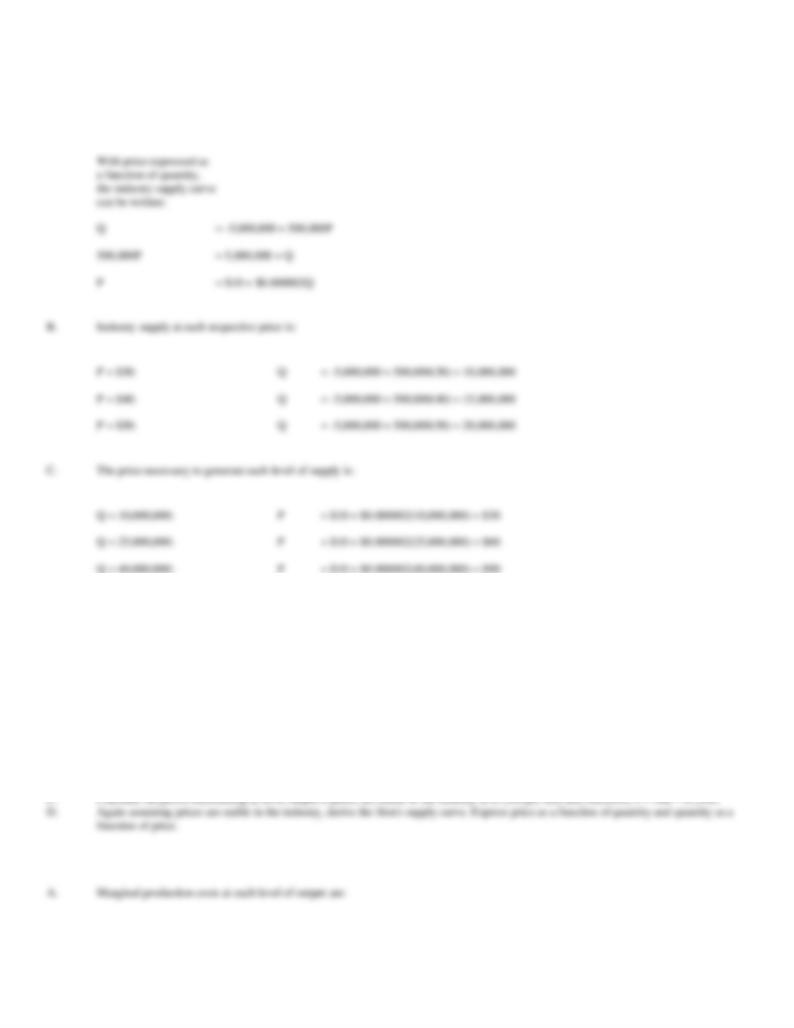
Q
= -3,000,000 + 500,000P - 800,000PL - 1,000,000PK + 300,000W
= -3,000,000 + 500,000P - 800,000(10) - 1,000,000(15)
+ 300,000(70)
= -5,000,000 + 500,000P
44. Supply Curve Analysis. Computers.com is a leading Internet retailer of high-performance desktop
computers. Based on an analysis of monthly cost and output data, the company has estimated the following
relation between its marginal cost of production and monthly output:
MC = ¶ TC/ ¶ Q = $100 + $0.005Q
A.
Calculate the marginal cost of production at 100,000, 200,000, and 300,000 units of output.
B.
Express output as a function of marginal cost. Calculate the level of output at which MC = $1,000, $1,500 and $2,000.
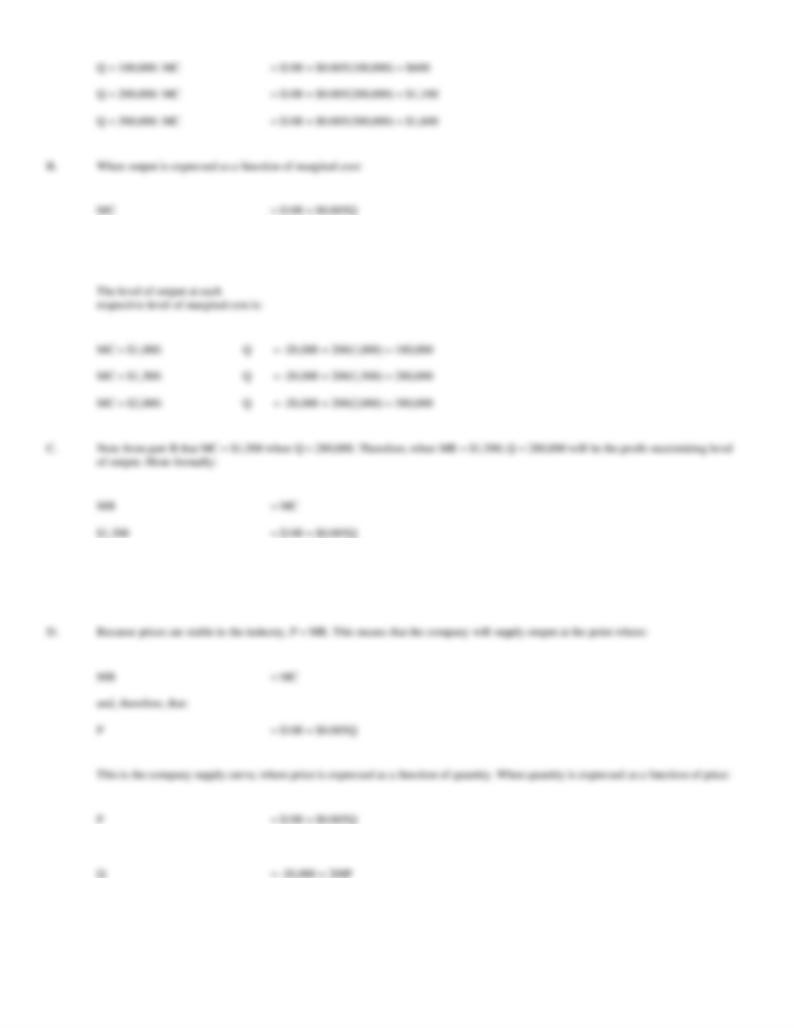
0.005Q
= -100 + MC
Q
= -20,000 + 200MC
0.005Q
= 1,400
Q
= 280,000
0.005Q
= -100 + P
45. Supply Curve Analysis. Credible Switches, Inc., is a distributor of generic safety switches used in the
washing machines and dryers. Based on an analysis of monthly cost and output data, the company has estimated
the following relation between the marginal cost (wholesale cost plus distribution cost per unit) and monthly
output:
MC = TC/ Q = $2 + $0.00001Q
A.
Calculate marginal cost at 400,000, 500,000, and 600,000 units of output.
B.
Express output as a function of marginal cost. Calculate the level of output at which MC = $5, $8, and $10.
0.00001Q
= -2 + MC
Q
= -200,000 + 100,000MC
0.00001Q
= 6
Q
= 600,000
0.00001Q
= -2 + P
46. Optimal Supply. Shake-n-Shing, Inc., is a supplier of wood shakes and shingles used in home construction.
Shakes and shingles are sold by the bundle. Based on an analysis of monthly cost and output data, the company
has estimated the following relation between its marginal costs and monthly output:
MC = TC/ Q = $50 + $0.00005Q
A.
Calculate marginal cost at 500,000, 700,000, and 900,000 bundles of output.
B.
Express output as a function of marginal cost. Calculate the level of output at which MC = $75, $100 and $125.
0.00005Q
= -50 + MC
Q
= -1,000,000 + 20,000MC
0.00005Q
= 50
Q
= 1,000,000
0.00005Q
= -50 + P
47. Industry Supply. Columbia Pharmaceuticals, Inc., and Princeton Medical, Ltd., supply a generic drug
equivalent of an antibiotic used to treat postoperative infections. Proprietary cost and output information for
each company reveal the following relations between marginal cost and output:
MCC
= TCC/ Q = $5 + $0.001QC
(Columbia)
MCP
= TCP/ Q = $6 + $0.00025QP
(Princeton)
The wholesale market for generic drugs is vigorously price-competitive, and neither firm is able to charge a premium for its products. Thus, P = MR
in this market.
A.
Determine the supply curve for each firm. Express price as a function of quantity and quantity as a function of price. (Hint: Set P = MR
= MC to find each firm's supply curve.)
0.001QC
= -5 + P
0.00025QP
= -6 + P
QC
= -5,000 + 1,000P
QP
= -24,000 + 4,000P
0. Because marginal cost rises with
48. Industry Supply. Stanford Plastics, Inc. and Cal-Tech Associates, Inc. supply a generic phone jack that
connects telephone cords to phone outlets. Proprietary cost and output information for each company reveal the
following relations between marginal cost and output:
MCS
= TCS/ Q = $1 + $0.00002QS
(Stanford)
MCC
= TCC/ Q = $1.50 + $0.000005QC
(Cal-Tech)
The wholesale market for modular phone jacks is vigorously price-competitive, and neither firm is able to charge a premium for its products. Thus, P
= MR in this market.
A.
Determine the supply curve for each firm. Express price as a function of quantity and quantity as a function of price. (Hint: Set P = MR
= MC to find each firm's supply curve.)
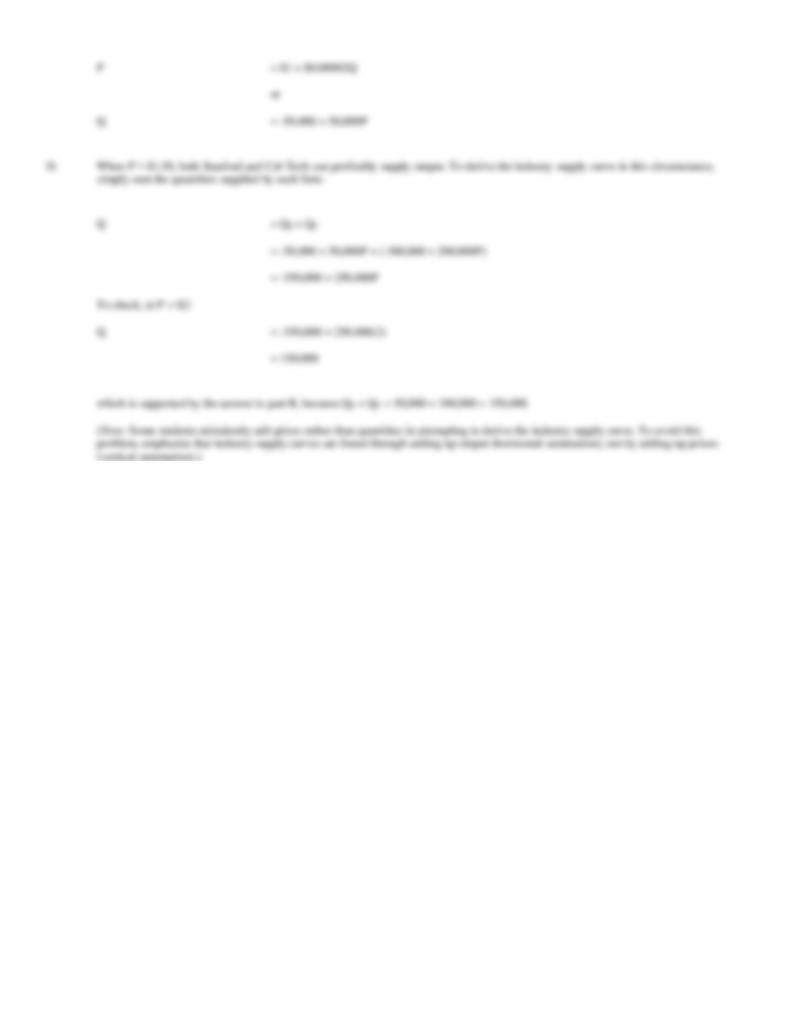
B.
Calculate the quantity supplied by each firm at prices of $1, $1.50, and $2. What is the minimum price necessary for each individual
0.00002QS
= -1 + P
0.000005QC
= -1.50 + P
QS
= -50,000 + 50,000P
QC
= -300,000 + 200,000P
49. Market Equilibrium. Florida Orange Juice is a product of Florida's Orange Growers' Association. Demand
and supply of the product are both highly sensitive to changes in the weather. During hot summer months,
demand for orange juice and other beverages grows rapidly. On the other hand, hot dry weather has an adverse
effect on supply by reducing the size of the orange crop.
Demand and supply functions for Florida orange juice are as follows:
QD
= 4,500,000 - 1,200,000P + 2,000,000PS
+ 1,500Y + 100,000T
(Demand)
QS
= 8,000,000 + 2,400,000P - 500,000PL
- 80,000PK - 120,000T
(Supply)
where P is the average price of Florida ($ per case), PS is the average retail price of canned soda ($ per case), Y is income (GNP in $billions), T is the
average daily high temperature (degrees), PL is the average price of unskilled labor ($ per hour), and PK is the average cost of capital (in percent).
A.
When quantity is expressed as a function of price, what are the Florida demand and supply curves if P = $11, PS = $5, Y = $12,000
billion, T = 75 degrees, PL = $6, and PK = 12.5%.
B.
Calculate the surplus or shortage of Florida orange juice when P = $5, $10, and $15.
C.
Calculate the market equilibrium price-output combination.
A.
When quantity is expressed as a function of price, the demand curve for Florida Orange Juice is:
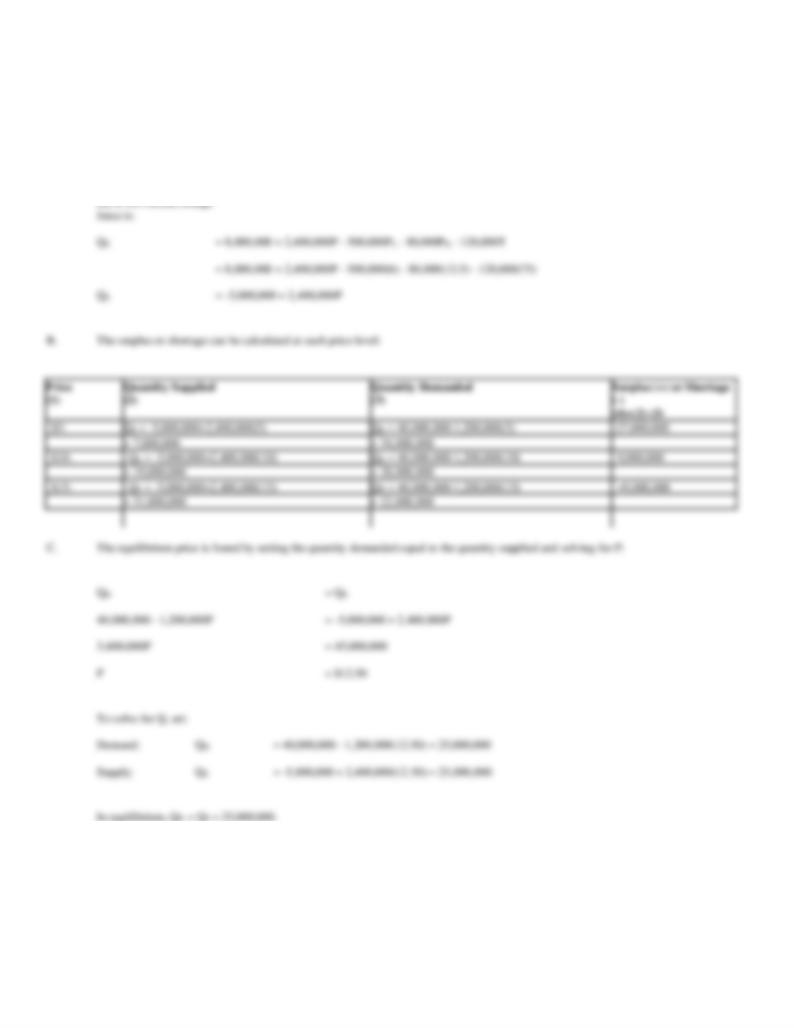
QD
= 4,500,000 - 1,200,000P + 2,000,000PS + 1,500Y + 100,000T
= 4,500,000 - 1,200,000P + 2,000,000(5) + 1,500(12,000)
+ 100,000(75)
QD
= 40,000,000 - 1,200,000P
When quantity is
expressed as a function
of price, the supply
50. Market Equilibrium. Various beverages are sold by roving vendors at Busch Stadium, home of the St.
Louis Cardinals. Demand and supply of the product are both highly sensitive to changes in the weather. During
hot summer months, demand for ice-cold beverages grows rapidly. On the other hand, hot dry weather has an
adverse effect on supply in that it taxes the stamina of the vendor carrying his or her goods up and down many
flights of stairs. The only competition for this service is provided by the beverages that can be purchased at
kiosks located throughout the stadium.
Demand and supply functions for ice-cold beverages per game are as follows:
QD
= 20,000 - 20,000P + 7,500PK + 0.8Y + 500T
(Demand)
QS
= 1,000 + 12,000P - 900PL - 1,000PC - 200T
(Supply)
where P is the average price of ice-cold beverage ($ per beverage), PK is the average price of beverages sold at the kiosks ($ per beverage), Y is
disposable income per household for baseball fans, T is the average daily high temperature (degrees), PL is the average price of unskilled labor ($ per
hour), and PC is the average cost of capital (in percent).
A.
When quantity is expressed as a function of price, what are the ice-cold beverage demand and supply curves if P = $5, PK = $4, Y =
$62,500, T = 80 degrees, PL = $10, and PC = 12%.
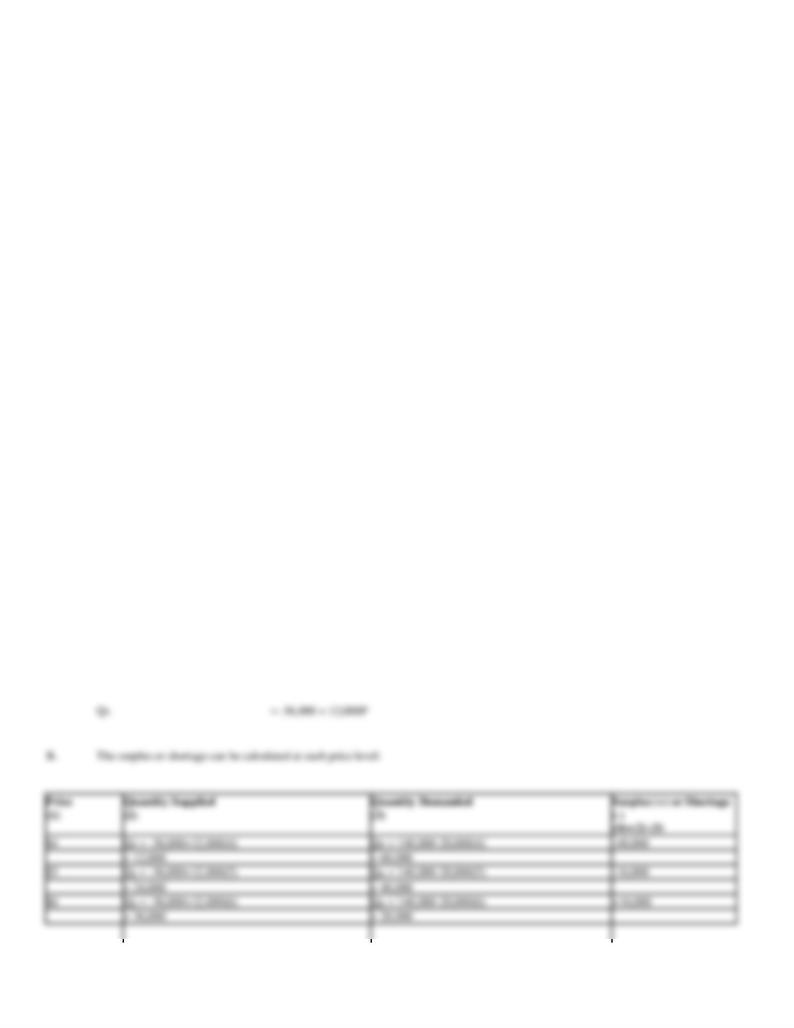
B.
Calculate the surplus or shortage of ice-cold beverage when P = $4, $5, and $6.
C.
Calculate the market equilibrium price-output combination.
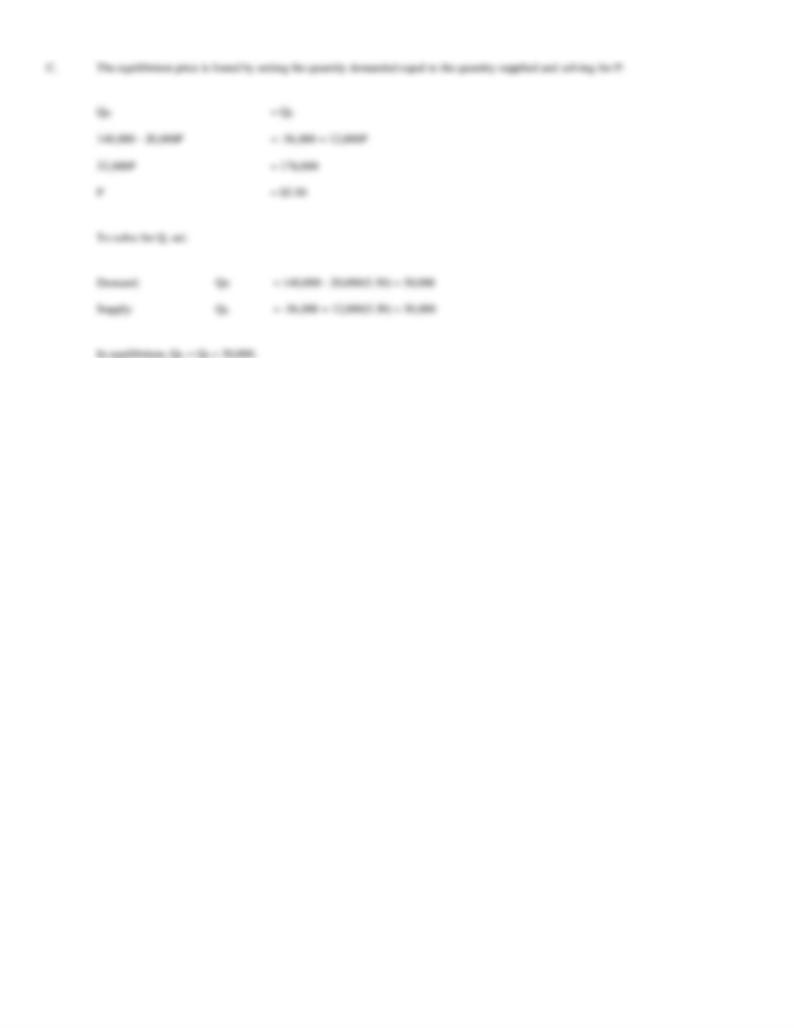
A.
When quantity is expressed as a function of price, the demand curve for ice-cold beverages per game is:
QD
= 20,000 - 20,000P + 7,500PK + 0.8Y + 500T
= 20,000 - 20,000P + 7,500(4) + 0.8(62,500) + 500(80)
QD
= 140,000 - 20,000P
When quantity is expressed as a function of price, the supply curve for ice-cold beverages per game is:
QS
= 1,000 + 12,000P - 900PL - 1,000PC - 200T
= 1,000 + 12,000P - 900(10) - 1,000(12) - 200(80)