CHAPTER 6--FORECASTING
Student: ___________________________________________________________________________

7. A secular trend is the:
A. annual pattern in sales or profits caused by weather, habit, or social custom.

12. If an economic time series is growing by a constant dollar amount each period, the most accurate forecast

19. A panel consensus formed by providing feedback without direct identification of individual positions is

24. To predict the effects on a particular industry of changes in other sectors of the economy forecasters should
employ:
A. time series analysis.
B. input-output analysis.
C. barometric methods.
D. steamroller techniques.
25. Which of the following does not indicate the relative accuracy of an economic forecast?
A. composite index.
B. sample mean forecast error.
C. stochastic error term.
D. simple correlation coefficient.
26. Annual Compounding. The following table shows annual sales data for Nanotechnology, Inc., over the
ten-year 1995-2005 period:
Year
Sales
($ Millions)
1995
$1.0
1996
1.1
1997
1.2
1998
1.2
1999
1.3
2000
1.4
2001
1.5
2002
1.9
2003
2.0
2004
2.5
2005
2.6
27. Annual Compounding. The following table shows annual sales data for Landrover, Inc., over the ten-year
1998-2008 period:
Year
Sales
($ Millions)
1998
$ 4.0
1999
4.8
2000
5.6
2001
6.4
2002
7.0
2003
7.6
2004
8.4
2005
9.2
2006
10.2
2007
11.2
2008
12.4
28. Annual Compounding. The following table shows annual sales data for Stuff Happens, Inc., over the
ten-year 1998-2008 period:
Year
Sales
($ Millions)
1998
$2.0
1999
2.2
2000
2.4
2001
2.6
2002
2.8
2003
3.0
2004
3.2
2005
3.5
2006
3.8
2007
4.1
2008
4.3
29. Annual Compounding. The following table shows annual sales data for Security Watch, Inc., over the
ten-year 1998-2008 period:
Year
Sales
($ Thousands)
1998
$100
1999
150
2000
200
2001
220
30. Continuous Compounding. Nicholas Nickelby, a quality control supervisor for Vinyl Windows, Inc., is
concerned about an increase in distribution costs per unit from $10 to $13.80 over the last four years. Nickelby
feels that setting up a new direct-sales distribution network at a cost of $17.50 per unit may soon be desirable.
A.
Calculate the unit cost growth rate using the constant rate of change model with continuous compounding.
B.
Forecast when unit distribution costs will exceed the current cost of direct-sales distribution.

31. Continuous Compounding. Elizabeth Corday, a quality control supervisor for Surgery Products, Inc., is
concerned about an increase in distribution costs for disposable syringes from $40 to $50 per case over the last
five years. Corday feels that setting up a new direct-sales distribution network at a cost of $58.50 per unit may
soon be desirable.
32. Continuous Compounding. Mark Greene, a control supervisor for County General, Inc., is concerned
about an increase in distribution costs per unit from $24.50 to $25 over the last four years. Greene feels that
setting up a new direct-sales distribution network at a cost of $27.50 per unit may soon be desirable.

33. Continuous Compounding. Abby Lockheart, a quality control supervisor for Intensive care, Inc., is
concerned about an increase in distribution costs per unit from $3 to $3.27 over the last three years. Lockheart
feels that setting up a new direct-sales distribution network at a cost of $3.56 per unit may soon be desirable.
34. Sales Forecast Modeling. The change in the quantity of product A demanded in any given week is
inversely proportional to the change in sales of product B in the previous week. That is, if sales of B rose by X
percent last week, sales of A can be expected to fall by X percent this week.
A.
Write the equation for next week's sales of A, using the symbols A = sales of Product A, B = sales of Product B, and t = time. Assume
there will be no shortages of either product.
B.
Last week 500 units of A and 250 units of B were sold. Two weeks ago, 200 units of Product B were sold. What would you predict the
sales of A to be this week?
35. Sales Forecast Modeling. The change in the quantity of Beta service demanded in any given week is
inversely proportional to the change in sales by Alpha in the previous week. That is, if sales of Alpha rose by X
percent last week, sales of Beta can be expected to fall by 0.5X percent this week.
A.
Write the equation for next week's sales of Beta, using the symbols B = sales of Beta services, A = Alpha sales, and t = time. Assume
there will be no shortages of either product.
B.
Last week 200 units of Beta and 450 units of Alpha were sold. Two weeks ago, 300 units of Alpha were sold. What would you predict
the sales of Beta to be this week?

36. Sales Forecast Modeling. The change in the quantity of Cheez Sticks demanded in any given week is
inversely proportional to the change in sales of Pretzel Q's in the previous week. That is, if sales of Pretzel Q's
fell by X percent last week, sales of Cheez Sticks can be expected to rise by 2X percent this week.
A.
Write the equation for next week's sales of Cheez Sticks, using the symbols C = sales of Cheez Sticks, Q = sales of Pretzel Q's, and t =
time. Assume there will be no shortages of either product.
B.
Last week 600 units of C and 350 units of Q were sold. Two weeks ago, 400 units of Q were sold. What would you predict the sales of
C to be this week?
37. Sales Forecast Modeling. The change in the quantity of product C demanded in any given week is
inversely proportional to the change in sales of product D in the previous week. That is, if sales of D rose by X
percent last week, sales of C can be expected to fall by X percent this week.
A.
Write the equation for next week's sales of C, using the symbols C = sales of product C, D = sales of product D, and t = time. Assume
there will be no shortages of either product.
B.
Last week 750 units of C and 600 units of D were sold. Two weeks ago, 500 units of product D were sold. What would you predict the
sales of C to be this week?
38. Sales Forecast Modeling. Consulting Associates, Ltd., would like to generate a sales forecast based on the
39. Sales Forecast Modeling. Engineering Consultants, Inc., would like to generate a sales forecast based on
the assumption that next year sales are a function of current income, advertising, and advertising by a
competing manufacturer:

40. Sales Forecast Modeling. Kerry Weaver, office manager for Pediatric Medicine, Ltd., would like to
41. Sales Forecast Modeling. Jeng-Mei Chen, Inc., an upscale Manhattan restaurant, would like to generate a
sales forecast based on the assumption that next year sales are a function of current income, advertising, and
advertising by a competing restaurant:

42. Cost Forecast Modeling. Elliot Ness, manager of product packaging at Chicago Tool & Die, Inc., is
evaluating the cost effectiveness of the preventive maintenance program in his department. Ness believes that
the monthly downtime of the packaging line due to equipment breakdown is related to the hours spent each
month on preventive maintenance.
A.
Write an equation to predict next month's downtime using the symbols D = downtime, M = preventive maintenance, t = time, a0 =
constant term, a1 = regression slope coefficient, and assuming that downtime in the forecast month decreases by the same percentage as
preventive maintenance increased during the preceding month.
43. Cost Forecast Modeling. Robert Romano, CEO of Rocket Science, Inc., is evaluating the cost effectiveness
of the preventive maintenance program. Romano believes that the monthly downtime of the accelerator line due
to equipment breakdown is related to the hours spent each month on preventive maintenance.
A.
Write an equation to predict next month's downtime using the symbols D = downtime, M = preventive maintenance, t = time, a0 =
constant term, a1 = regression slope coefficient, and assuming that downtime in the forecast month decreases by half of the percentage
increase in preventive maintenance during the preceding month.
44. Cost Forecast Modeling. John Carter, an intern at Medical Products, Inc., is evaluating the cost
effectiveness of a training program in his department. Carter believes that the monthly rejection rate is inversely
related to the hours spent each month on worker training.
A.
Write an equation to predict next month's rejection rate using the symbols R = rejection rate, T = worker training, t = time, a0 = constant
term, a1 = regression slope coefficient, and assuming that the rejection rate in the forecast month decreases by twice the percentage
increase in worker training during the preceding month.
45. Sales Forecasting. Samurai, Ltd., must forecast sales for a popular trivia game in order to avoid stockouts
46. Sales Forecasting. The World Bazaar, Ltd., must forecast sales for indoor electric grills in order to avoid

47. Simultaneous Equations. The Metropolitan Symphony in Toledo, Ohio, has had great success with a
"Senior Citizens' Night" promotion. By offering half off its regular $20 admission price, average nightly
attendance has risen from 4,000 to 6,000 persons. Beverage (B) and other concession (C) revenues tied to
attendance have also risen dramatically. Historically, Metropolitan Symphony has found that 75% of all concert
goers will buy a $3 beverage, whereas 10% of all concert goers plus 40% of those buying beverages will spend
$2 on hors d'oeuvres and other concessions.
48. Simultaneous Equations. Buckeye Cinema, Inc., which runs a chain of movie theaters in the state of Ohio,
has had great success with a "Tuesday Night at the Movies" promotion. By offering half off its regular $8
admission price, average nightly attendance has risen from 400 to 800 persons. Popcorn (Pop) and other
concession (C) revenues tied to attendance have also risen dramatically. Historically, Buckeye Cinema has
found that 50% of all movie goers will buy a $4 cup of popcorn, whereas 25% of all movie goers plus 50% of
those buying popcorn will spend $3 on soda and other concessions.
49. Simultaneous Equations. Macrosoft, Inc., based in Seattle, Washington, manufactures a wide range of
parts for the aircraft, automotive, and agricultural equipment industries. The company is currently evaluating
the merits of building a new plant in order to fulfill a new contract with the federal government. The alternative
to expansion is to use additional overtime, reduce other production, or a combination of both. The company will
add new capacity only if the economy appears to be expanding. Forecasting the general economic activity of the
United States is therefore an important input to the decision making process. The firm has collected data and
estimated the following relations for the U. S. economy:
Last year's total profits (all corporations) Pt-1
= $1,200 billion
This year's government expenditures G
= $3,000 billion
Annual consumption expenditures C
= $800 billion + 0.75Y + u
50. Simultaneous Equations. Gates Equipment, Inc., manufactures a wide range of parts for the agricultural
equipment industry. The company is currently evaluating the merits of building a new plant in order to fulfill a
new contract with a large export concern. The alternative to expansion is to use additional overtime, reduce
other production, or a combination of both. The company will add new capacity only if the regional economy
appears to be expanding. Forecasting the general economic activity of the United States is therefore an
important input to the decision making process. The firm has collected data and estimated the following
relations for the U. S. economy:
Last year's total profits (all corporations) Pt-1
= $1,400 billion
This year's government expenditures G
= $2,800 billion
Annual consumption expenditures C
= $800 billion + 0.8Y + u
CHAPTER 6--FORECASTING Key
7. A secular trend is the:
A. annual pattern in sales or profits caused by weather, habit, or social custom.

12. If an economic time series is growing by a constant dollar amount each period, the most accurate forecast
19. A panel consensus formed by providing feedback without direct identification of individual positions is
24. To predict the effects on a particular industry of changes in other sectors of the economy forecasters should
employ:
A. time series analysis.
B. input-output analysis.
C. barometric methods.
D. steamroller techniques.
25. Which of the following does not indicate the relative accuracy of an economic forecast?
A. composite index.
B. sample mean forecast error.
C. stochastic error term.
D. simple correlation coefficient.
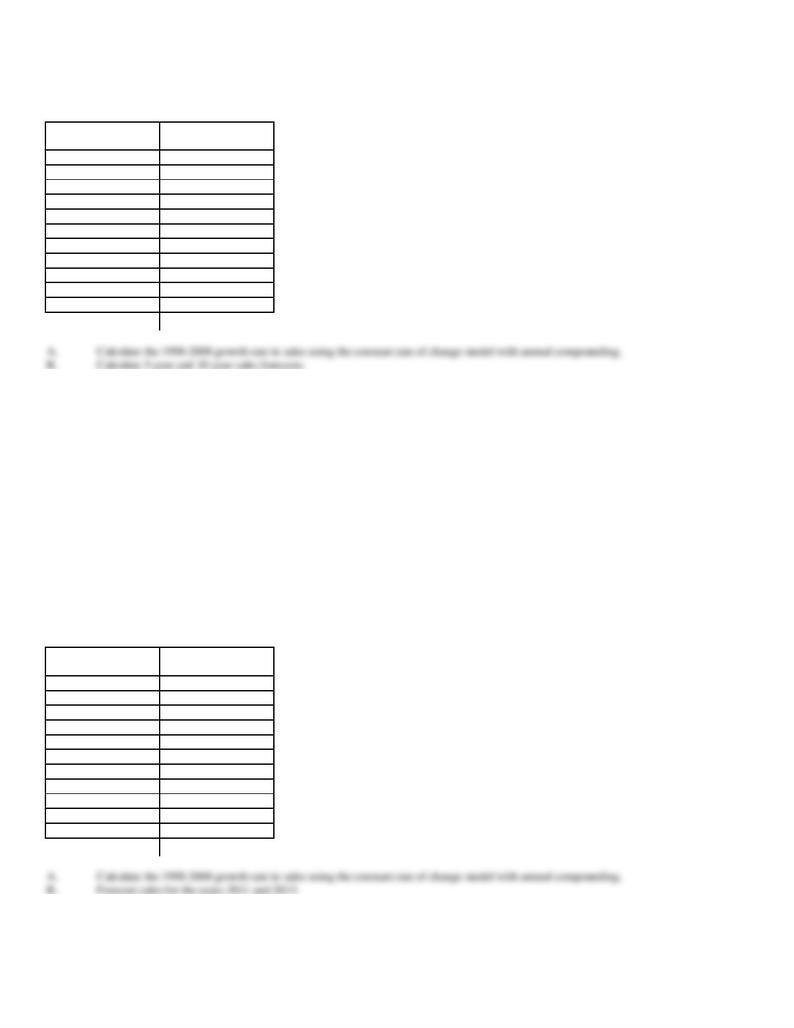
26. Annual Compounding. The following table shows annual sales data for Nanotechnology, Inc., over the
ten-year 1995-2005 period:
Year
Sales
($ Millions)
1995
$1.0
1996
1.1
1997
1.2
1998
1.2
1999
1.3
2000
1.4
2001
1.5
2002
1.9
2003
2.0
2004
2.5
2005
2.6
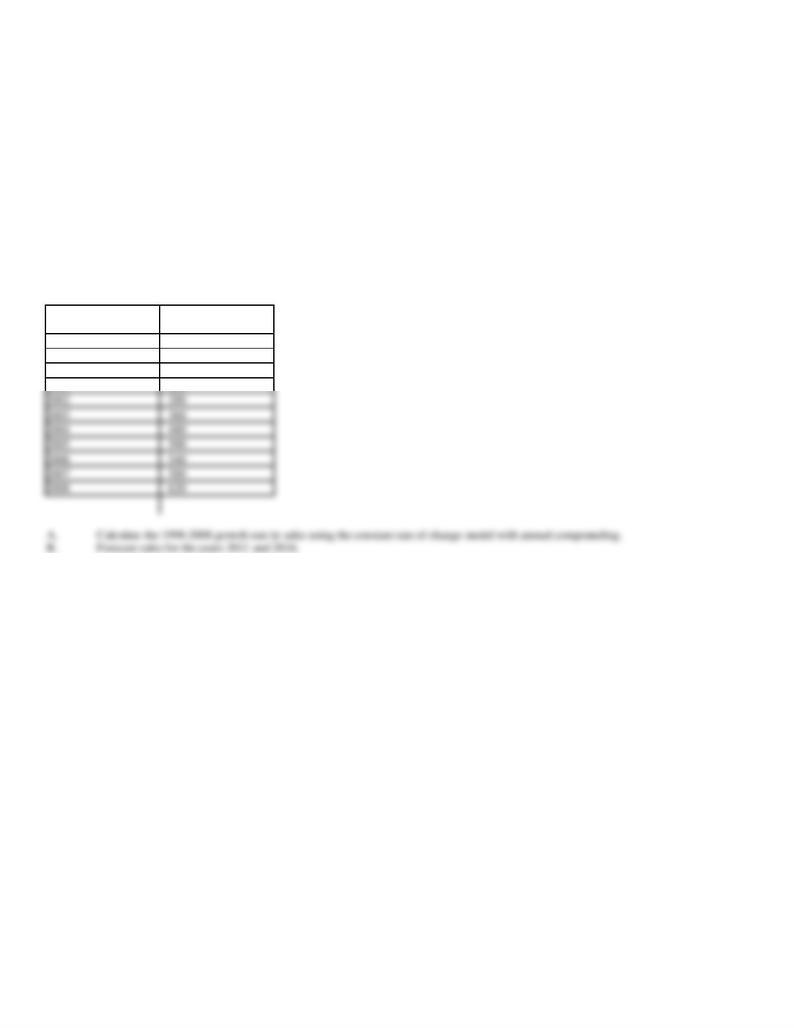
A.
Calculate the 1995-2005 growth rate in sales using the constant rate of change model with annual compounding.
B.
Forecast sales for the years 2010 and 2015.
2.6
= (1 + g)10
0.956/10
= ln(1 + g)
e(0.0956) - 1
= g
27. Annual Compounding. The following table shows annual sales data for Landrover, Inc., over the ten-year
1998-2008 period:
Year
Sales
($ Millions)
1998
$ 4.0
1999
4.8
2000
5.6
2001
6.4
2002
7.0
2003
7.6
2004
8.4
2005
9.2
2006
10.2
2007
11.2
2008
12.4
A.
Calculate the 1998-2008 growth rate in sales using the constant rate of change model with annual compounding.
B.
Calculate 5-year and 10-year sales forecasts.
3.1
= (1 + g)10
1.131/10
= ln(1 + g)
e(0.1131) - 1
= g
28. Annual Compounding. The following table shows annual sales data for Stuff Happens, Inc., over the
ten-year 1998-2008 period:
Year
Sales
($ Millions)
1998
$2.0
1999
2.2
2000
2.4
2001
2.6
2002
2.8
2003
3.0
2004
3.2
2005
3.5
2006
3.8
2007
4.1
2008
4.3
2.15
= (1 + g)10
0.765/10
= ln(1 + g)
e(0.0765) - 1
= g
29. Annual Compounding. The following table shows annual sales data for Security Watch, Inc., over the
ten-year 1998-2008 period:
Year
Sales
($ Thousands)
1998
$100
1999
150
2000
200
2001
220
2002
280
6.2
= (1 + g)10
1.824/10
= ln(1 + g)
e(0.1824) - 1
= g
30. Continuous Compounding. Nicholas Nickelby, a quality control supervisor for Vinyl Windows, Inc., is
concerned about an increase in distribution costs per unit from $10 to $13.80 over the last four years. Nickelby
feels that setting up a new direct-sales distribution network at a cost of $17.50 per unit may soon be desirable.
A.
Calculate the unit cost growth rate using the constant rate of change model with continuous compounding.
B.
Forecast when unit distribution costs will exceed the current cost of direct-sales distribution.
A.
Ct
= C0egt
$13.80
= $10e4g
13.80/10
= e4g
1.38
= e4g
ln(1.38)
= 4g
17.5/13.8
= e(0.08)t
1.27
= e(0.08)t
ln(1.27)
= 0.08t
31. Continuous Compounding. Elizabeth Corday, a quality control supervisor for Surgery Products, Inc., is
concerned about an increase in distribution costs for disposable syringes from $40 to $50 per case over the last
five years. Corday feels that setting up a new direct-sales distribution network at a cost of $58.50 per unit may
soon be desirable.
A.
Calculate the unit cost growth rate using the constant rate of change model with continuous compounding.
B.
Forecast when unit distribution costs will exceed the current cost of direct-sales distribution.

A.
Ct
= C0egt
$50
= $40e5g
50/40
= e5g
1.25
= e5g
ln(1.25)
= 5g
58.5/50
= e(0.04)t
1.17
= e(0.04)t
ln(1.17)
= 0.04t
32. Continuous Compounding. Mark Greene, a control supervisor for County General, Inc., is concerned
about an increase in distribution costs per unit from $24.50 to $25 over the last four years. Greene feels that
setting up a new direct-sales distribution network at a cost of $27.50 per unit may soon be desirable.
A.
Calculate the unit cost growth rate using the constant rate of change model with continuous compounding.
B.
Forecast when unit distribution costs will exceed the current cost of direct-sales distribution.
A.
Ct
= C0egt
$25
= $24.50e4g
25/24.50
= e4g
1.02
= e4g
ln(1.02)
= 4g
27.5/25
= e(0.05)t
1.10
= e(0.05)t
ln(1.10)
= 0.05t
33. Continuous Compounding. Abby Lockheart, a quality control supervisor for Intensive care, Inc., is
concerned about an increase in distribution costs per unit from $3 to $3.27 over the last three years. Lockheart
feels that setting up a new direct-sales distribution network at a cost of $3.56 per unit may soon be desirable.
A.
Calculate the unit cost growth rate using the constant rate of change model with continuous compounding.
B.
Forecast when unit distribution costs will exceed the current cost of direct-sales distribution.
A.
Ct
= C0egt
$3.27
= $3e3g
3.27/3
= e3g
1.09
= e3g
ln(1.09)
= 3g
3.56/3.27
= e(0.03)t
1.09
= e(0.03)t
ln(1.09)
= 0.03t
34. Sales Forecast Modeling. The change in the quantity of product A demanded in any given week is
inversely proportional to the change in sales of product B in the previous week. That is, if sales of B rose by X
percent last week, sales of A can be expected to fall by X percent this week.
A.
Write the equation for next week's sales of A, using the symbols A = sales of Product A, B = sales of Product B, and t = time. Assume
there will be no shortages of either product.
35. Sales Forecast Modeling. The change in the quantity of Beta service demanded in any given week is
inversely proportional to the change in sales by Alpha in the previous week. That is, if sales of Alpha rose by X
percent last week, sales of Beta can be expected to fall by 0.5X percent this week.
A.
Write the equation for next week's sales of Beta, using the symbols B = sales of Beta services, A = Alpha sales, and t = time. Assume
there will be no shortages of either product.
36. Sales Forecast Modeling. The change in the quantity of Cheez Sticks demanded in any given week is
inversely proportional to the change in sales of Pretzel Q's in the previous week. That is, if sales of Pretzel Q's
fell by X percent last week, sales of Cheez Sticks can be expected to rise by 2X percent this week.
A.
Write the equation for next week's sales of Cheez Sticks, using the symbols C = sales of Cheez Sticks, Q = sales of Pretzel Q's, and t =
time. Assume there will be no shortages of either product.
37. Sales Forecast Modeling. The change in the quantity of product C demanded in any given week is
inversely proportional to the change in sales of product D in the previous week. That is, if sales of D rose by X
percent last week, sales of C can be expected to fall by X percent this week.
A.
Write the equation for next week's sales of C, using the symbols C = sales of product C, D = sales of product D, and t = time. Assume
there will be no shortages of either product.
38. Sales Forecast Modeling. Consulting Associates, Ltd., would like to generate a sales forecast based on the
assumption that next year sales are a function of current income, advertising, and advertising by a competing
retailer:
A.
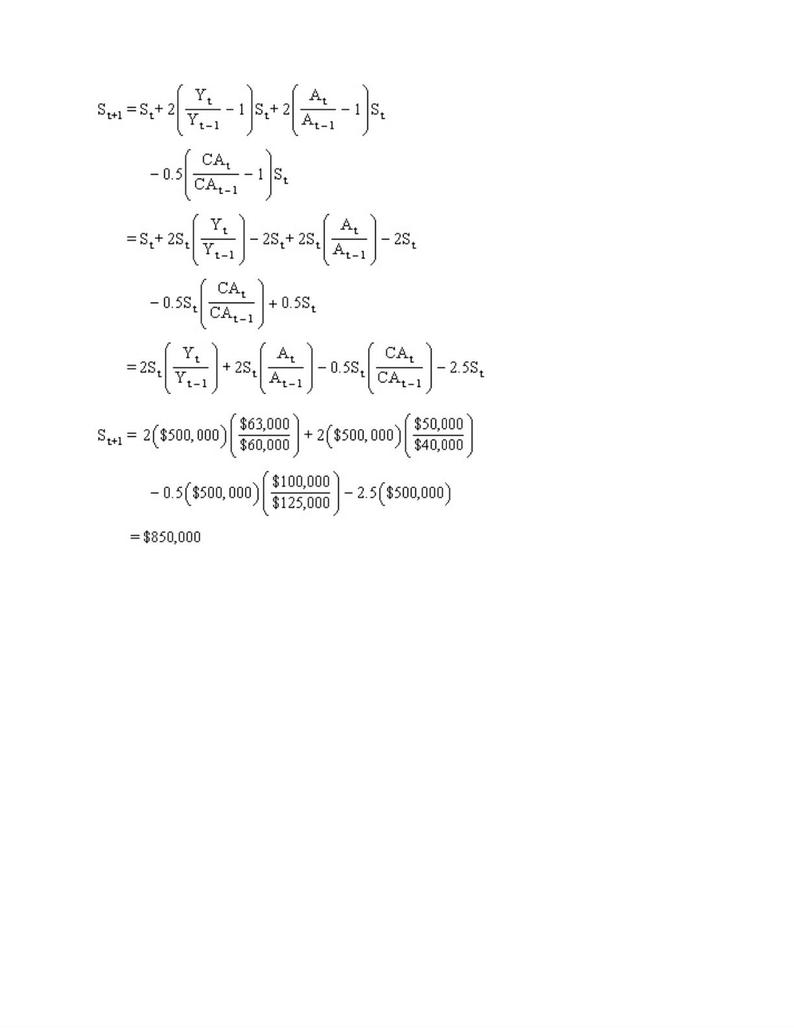
Write an equation for predicting sales based on the assumption that the percentage change in sales is twice as large as the percentage
change in income and advertising; but only one-half as large as, and of the opposite sign of, the percentage change in competitor
advertising. Use the symbols S = sales, Y = income, A = advertising, and CA = competitor advertising.
B.
During the current year, sales total $500,000, income is $63,000 per capita, advertising is $50,000, and competitor advertising is
$100,000. Previous period levels were $60,000 (income), $40,000 (advertising), and $125,000 (competitor advertising). Forecast next
year sales.
A.
B.
39. Sales Forecast Modeling. Engineering Consultants, Inc., would like to generate a sales forecast based on
the assumption that next year sales are a function of current income, advertising, and advertising by a
competing manufacturer:
A.
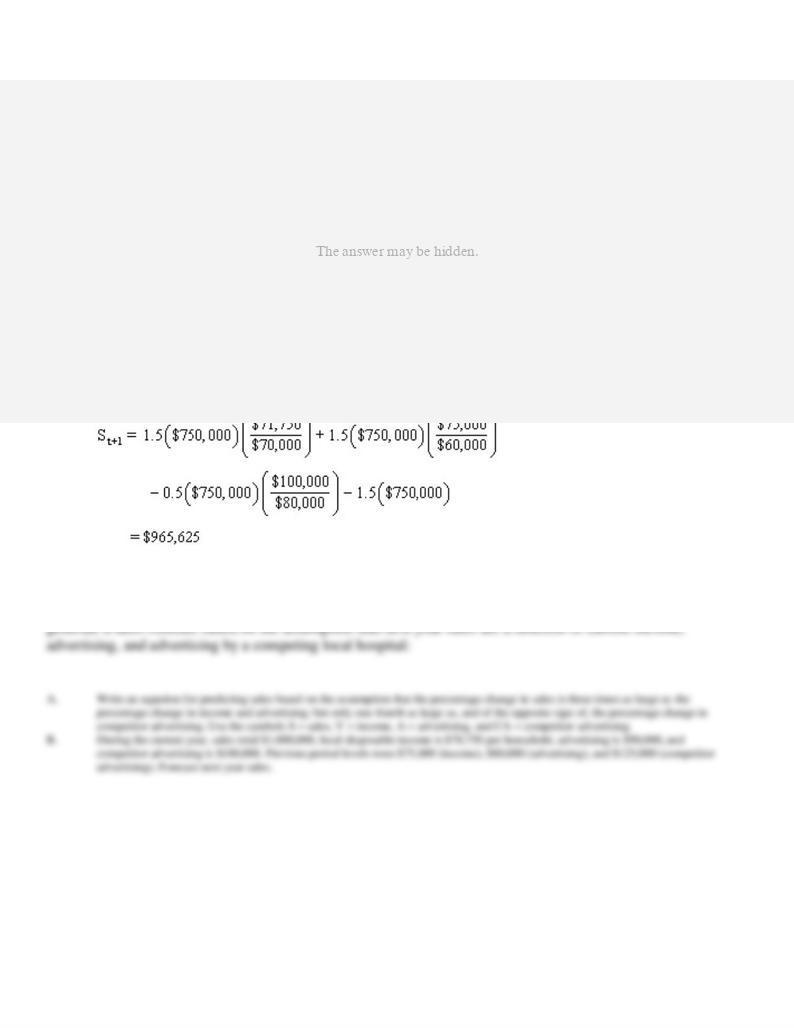
Write an equation for predicting sales based on the assumption that the percentage change in sales is one-and-a-half as large as the
percentage change in income and advertising; but only one-half as large as, and of the opposite sign of, the percentage change in
competitor advertising. Use the symbols S = sales, Y = income, A = advertising, and CA = competitor advertising.
B.
During the current year, sales total $750,000, income is $71,750 per capita, advertising is $75,000, and competitor advertising is
$100,000. Previous period levels were $70,000 (income), $60,000 (advertising), and $80,000 (competitor advertising). Forecast next
year sales.
40. Sales Forecast Modeling. Kerry Weaver, office manager for Pediatric Medicine, Ltd., would like to
41. Sales Forecast Modeling. Jeng-Mei Chen, Inc., an upscale Manhattan restaurant, would like to generate a
sales forecast based on the assumption that next year sales are a function of current income, advertising, and
advertising by a competing restaurant:
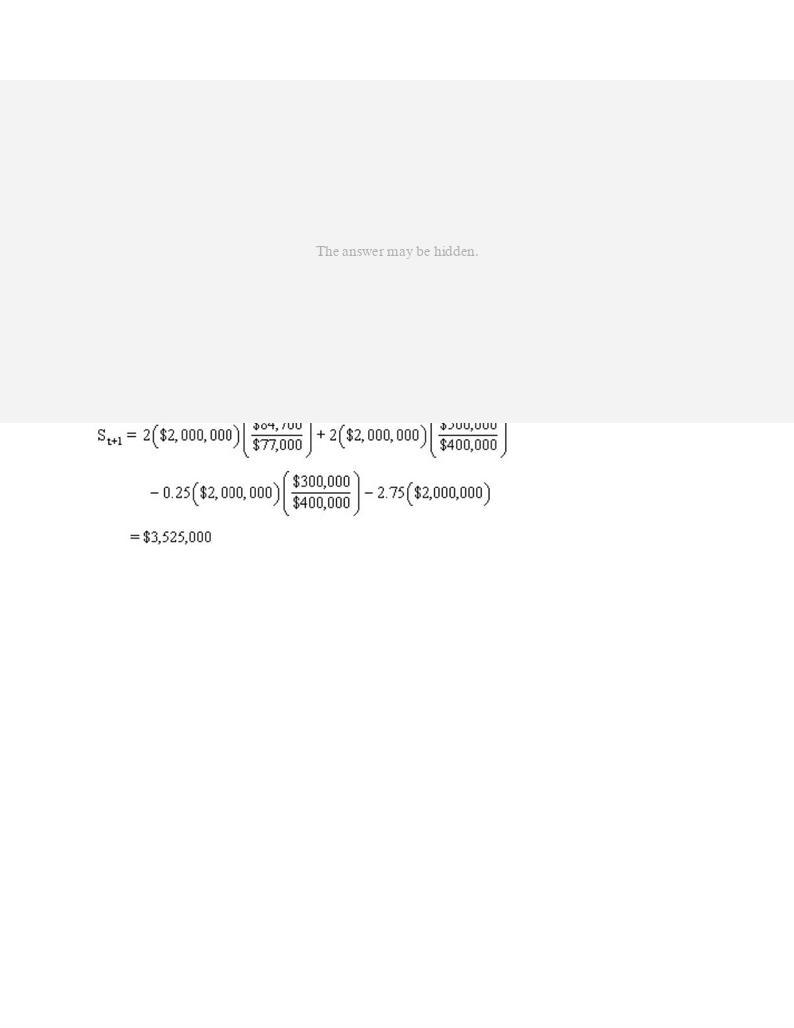
A.
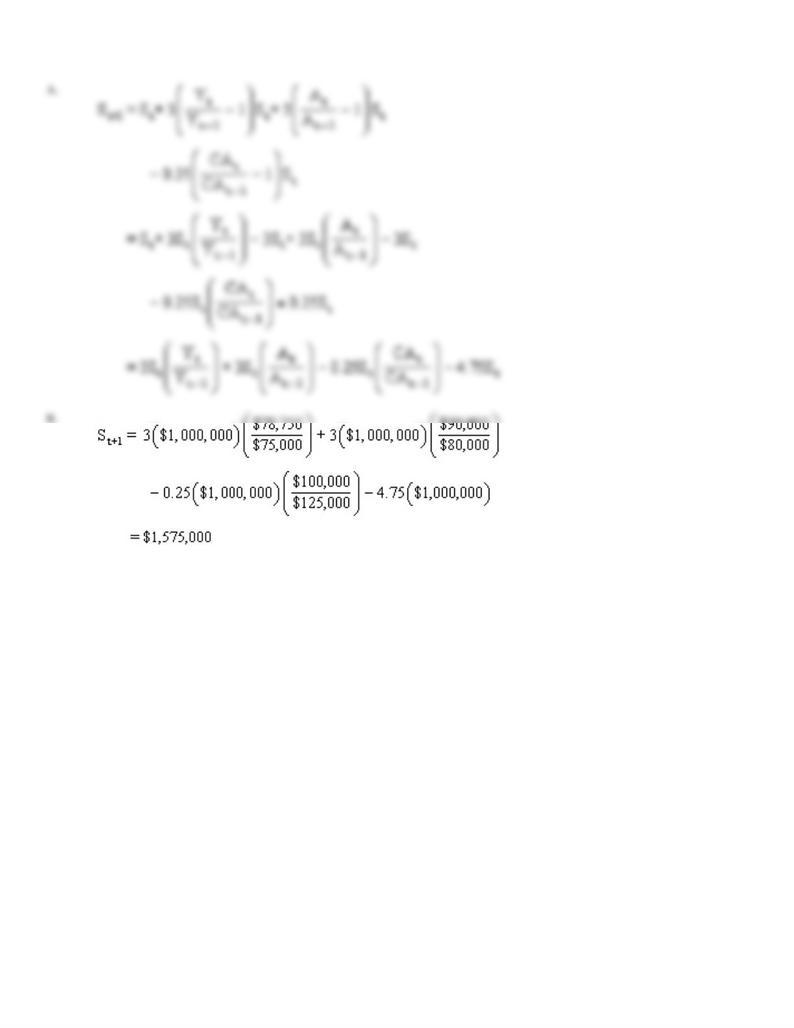
Write an equation for predicting sales based on the assumption that the percentage change in sales is twice as large as the percentage
change in income and advertising; but only one-fourth as large as, and of the opposite sign of, the percentage change in competitor
advertising. Use the symbols S = sales, Y = income, A = advertising, and CA = competitor advertising.
B.
During the current year, sales total $2,000,000, income is $84,700 per capita, advertising is $500,000, and competitor advertising is
$300,000. Previous period levels were $77,000 (income), $400,000 (advertising), and $400,000 (competitor advertising). Forecast next
year sales.
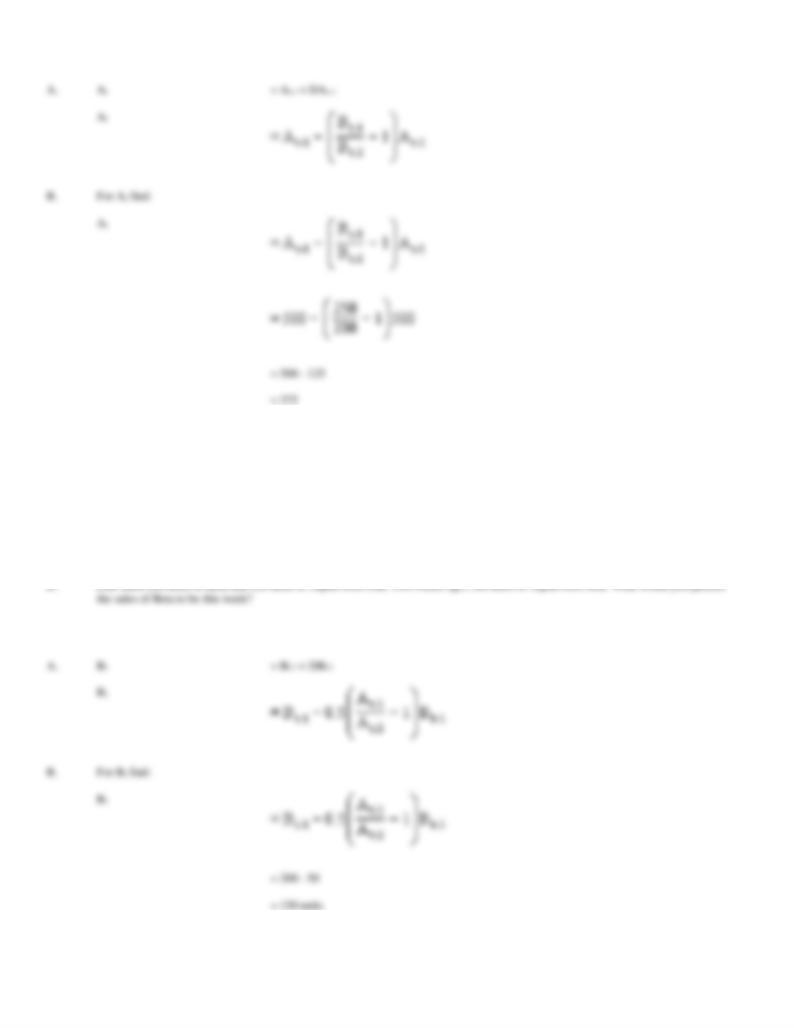
42. Cost Forecast Modeling. Elliot Ness, manager of product packaging at Chicago Tool & Die, Inc., is
evaluating the cost effectiveness of the preventive maintenance program in his department. Ness believes that
the monthly downtime of the packaging line due to equipment breakdown is related to the hours spent each
month on preventive maintenance.
A.
Write an equation to predict next month's downtime using the symbols D = downtime, M = preventive maintenance, t = time, a0 =
constant term, a1 = regression slope coefficient, and assuming that downtime in the forecast month decreases by the same percentage as
preventive maintenance increased during the preceding month.
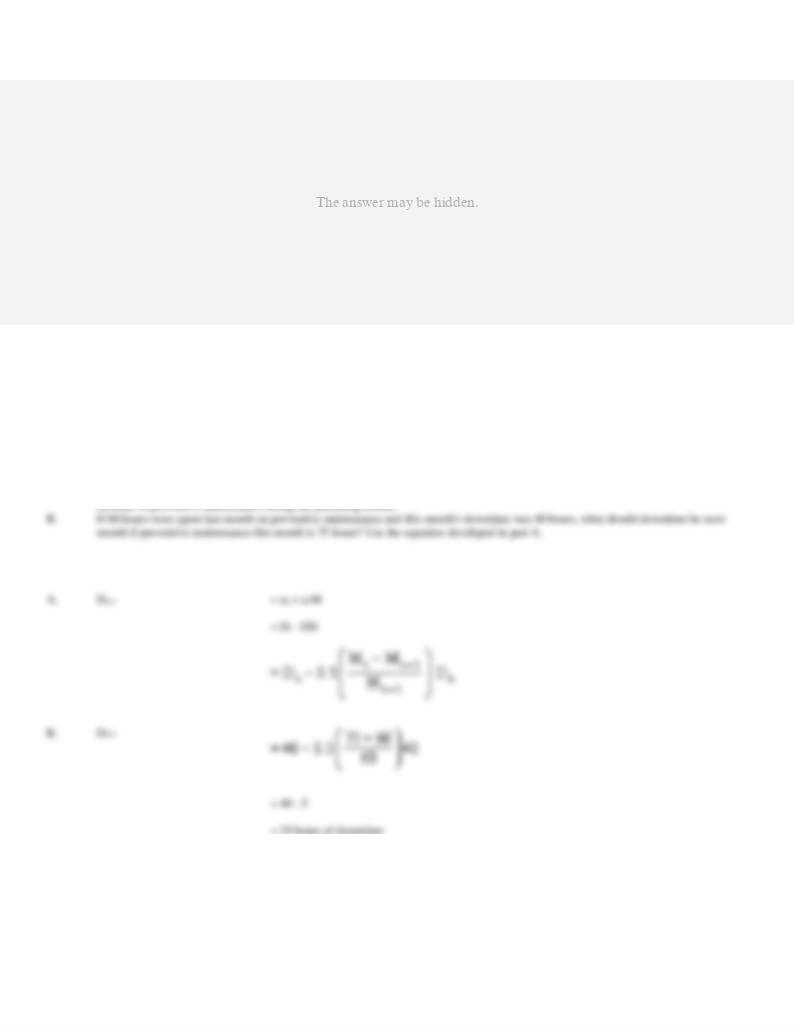
B.
If 75 hours were spent last month on preventive maintenance and this month's downtime was 50 hours, what should downtime be next
month if preventive maintenance this month is 90 hours? Use the equation developed in part A.
43. Cost Forecast Modeling. Robert Romano, CEO of Rocket Science, Inc., is evaluating the cost effectiveness
of the preventive maintenance program. Romano believes that the monthly downtime of the accelerator line due
to equipment breakdown is related to the hours spent each month on preventive maintenance.
A.
Write an equation to predict next month's downtime using the symbols D = downtime, M = preventive maintenance, t = time, a0 =
constant term, a1 = regression slope coefficient, and assuming that downtime in the forecast month decreases by half of the percentage
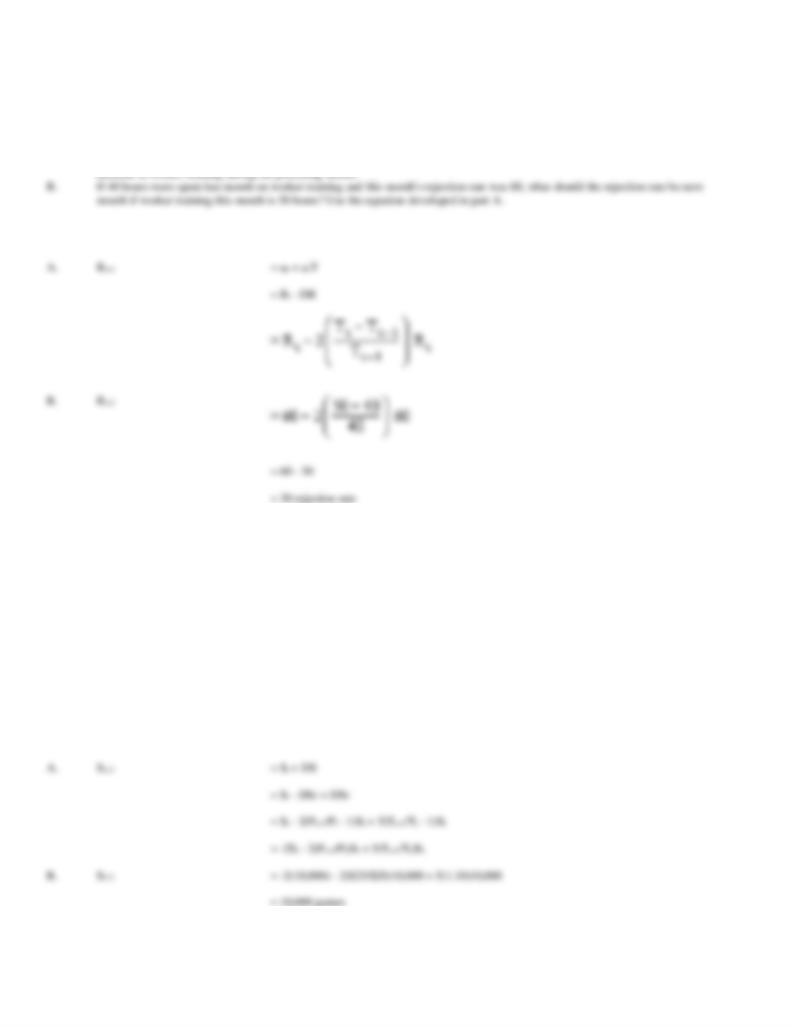
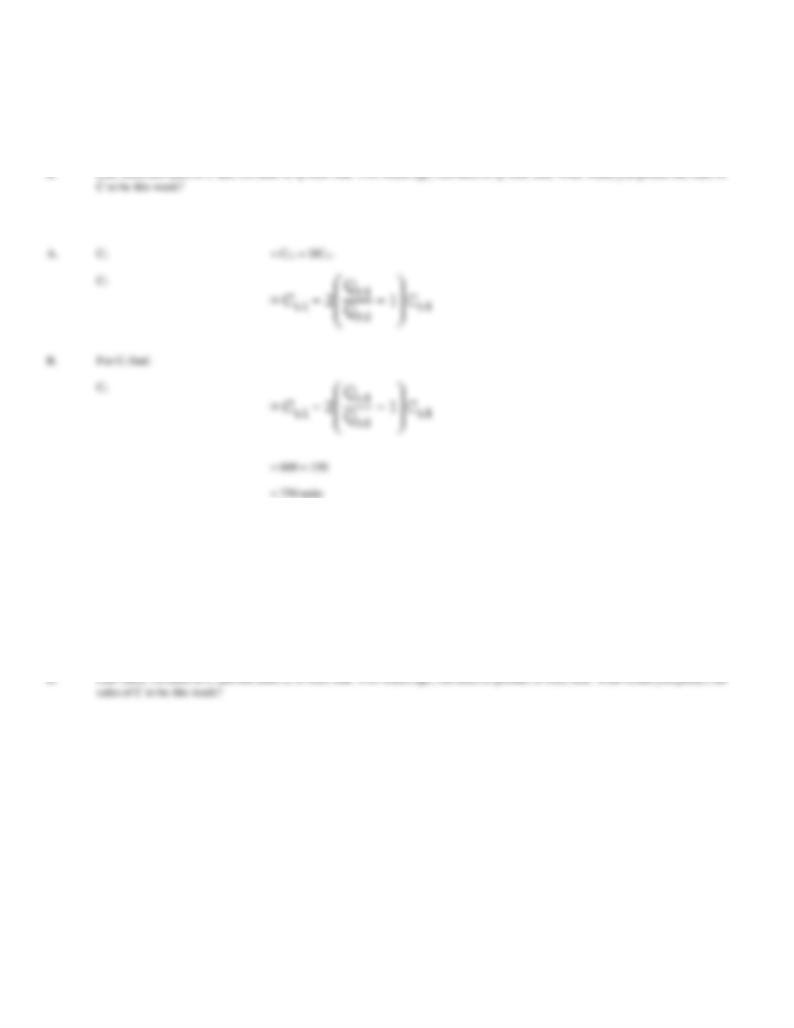
44. Cost Forecast Modeling. John Carter, an intern at Medical Products, Inc., is evaluating the cost
effectiveness of a training program in his department. Carter believes that the monthly rejection rate is inversely
related to the hours spent each month on worker training.
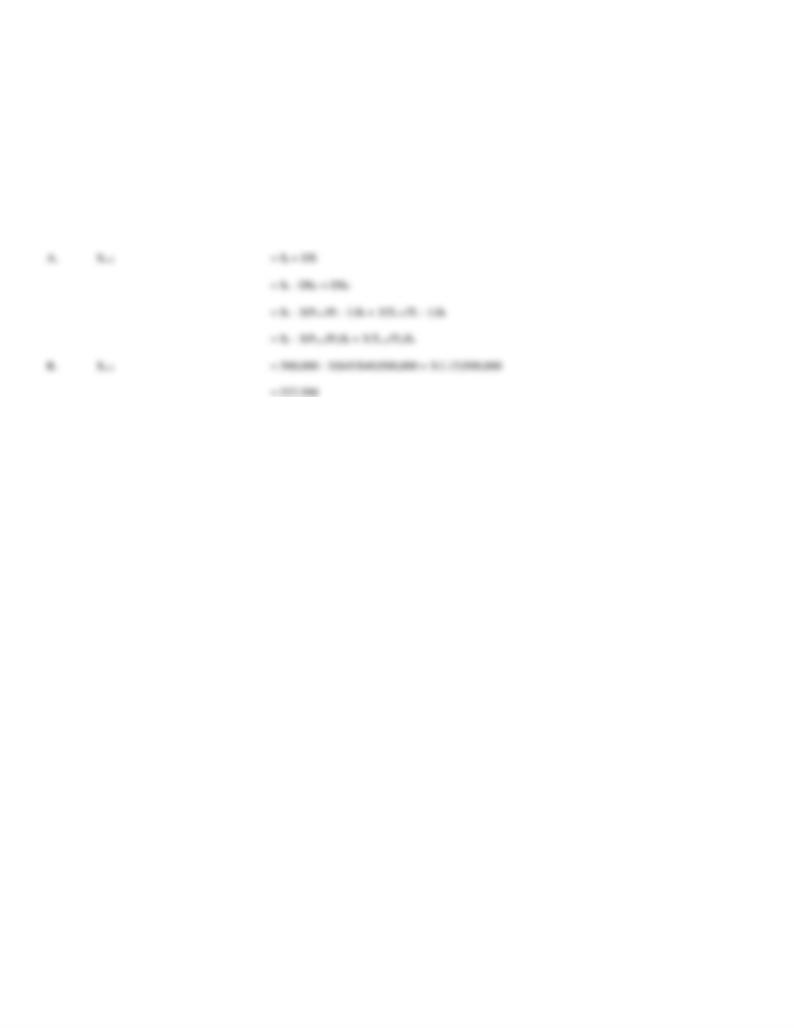
A.
Write an equation to predict next month's rejection rate using the symbols R = rejection rate, T = worker training, t = time, a0 = constant
term, a1 = regression slope coefficient, and assuming that the rejection rate in the forecast month decreases by twice the percentage
45. Sales Forecasting. Samurai, Ltd., must forecast sales for a popular trivia game in order to avoid stockouts
or excessive inventory charges during the coming Christmas season. In percentage terms, the company
estimates that game sales fall at double the rate of price increases and grow at five times the rate of customer
traffic increases. Furthermore, these effects seem to be independent.
A.
Write an equation for estimating the Christmas season sales, using the symbols S = sales, P = price, T = traffic, and t = time.
B.
Forecast this season's sales if Samurai sold 10,000 games last season at $20 each, this season's price is anticipated to be $25, and
customer traffic is expected to rise by 10% over previous levels.
46. Sales Forecasting. The World Bazaar, Ltd., must forecast sales for indoor electric grills in order to avoid
stockouts or excessive inventory charges during the coming Christmas season. In percentage terms, the
company estimates that electric grill sales fall at triple the rate of price increases and grow at three times the rate
of customer traffic increases. Furthermore, these effects seem to be independent.
A.
Write an equation for estimating the Christmas season sales, using the symbols S = sales, P = price, T = traffic, and t = time.
B.
Forecast this season's sales if the World Bazaar sold 500,000 indoor electric grills last season at $40 each, this season's price is
anticipated to be $45, and customer traffic is expected to rise by 15% over previous levels.
47. Simultaneous Equations. The Metropolitan Symphony in Toledo, Ohio, has had great success with a
"Senior Citizens' Night" promotion. By offering half off its regular $20 admission price, average nightly
attendance has risen from 4,000 to 6,000 persons. Beverage (B) and other concession (C) revenues tied to
attendance have also risen dramatically. Historically, Metropolitan Symphony has found that 75% of all concert
goers will buy a $3 beverage, whereas 10% of all concert goers plus 40% of those buying beverages will spend
$2 on hors d'oeuvres and other concessions.
A.
Write an expression describing total revenue from tickets plus beverage plus other concessions.
B.
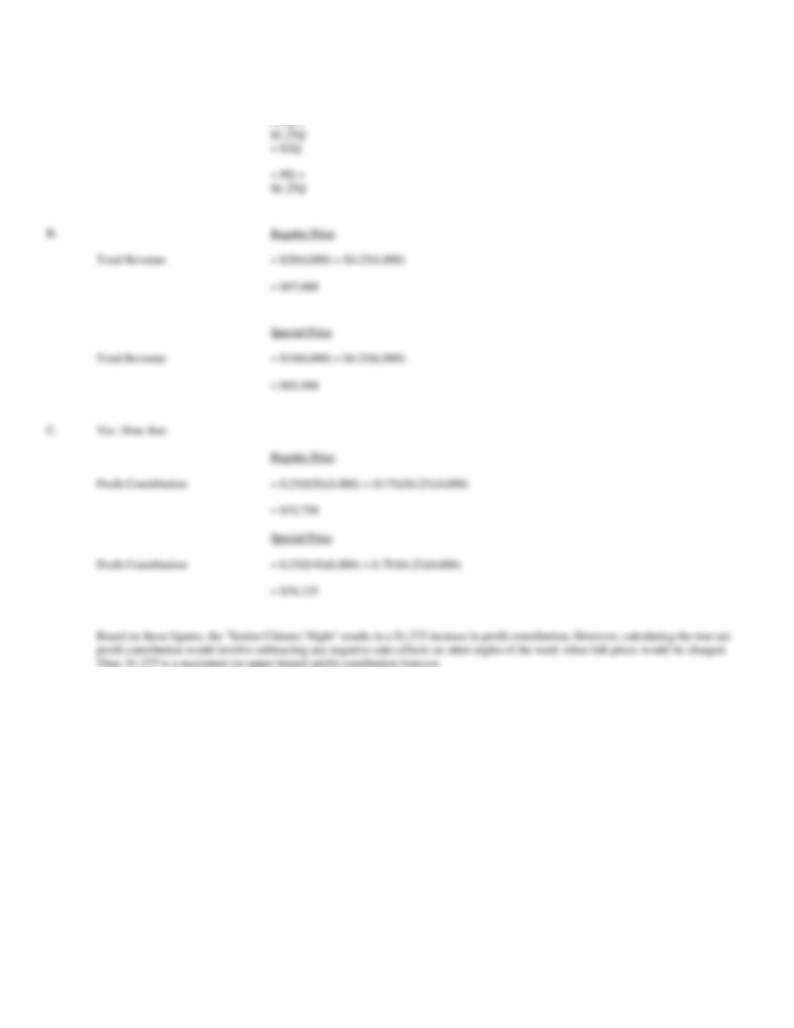
Forecast total revenues for both regular and special senior citizens' night pricing.
C.
If the profit contribution is 25% on concert ticket revenues, and 75% on beverages and other concession revenues, is the pricing
promotion profitable?
A.
If Q is the number of concert goers, then:
Ticket Revenue
= PQ
Beverage Revenue
= $3B
= 3(0.75Q)
= $2.25Q
Other Concession Revenue
= $2C
= $2(0.10Q + 0.40B)
= $2(0.10Q + 0.40(2.25Q))
= $2Q
Therefore,
Total Revenue
=
Ticket Revenue
+
Beverage Revenue
+
Other Concession Revenue
48. Simultaneous Equations. Buckeye Cinema, Inc., which runs a chain of movie theaters in the state of Ohio,
has had great success with a "Tuesday Night at the Movies" promotion. By offering half off its regular $8
admission price, average nightly attendance has risen from 400 to 800 persons. Popcorn (Pop) and other
concession (C) revenues tied to attendance have also risen dramatically. Historically, Buckeye Cinema has
found that 50% of all movie goers will buy a $4 cup of popcorn, whereas 25% of all movie goers plus 50% of
those buying popcorn will spend $3 on soda and other concessions.
A.
Write an expression describing total revenue from tickets plus popcorn plus other concessions.
B.
Forecast total revenues for both regular and special Tuesday-night pricing.
C.
If the profit contribution is 25% on movie ticket revenues, and 75% on popcorn and other concession revenues, is the pricing promotion
profitable?
A.
If Q is the number of movie goers, then:
Ticket Revenue
= PQ
Popcorn Revenue
= $4Pop
= 4(0.5Q)
Q
+
$
1.
Q
=
P
Q
+
$
3.
5
0
Q
B.
Regular Price
Total Revenue
= $8(400) + $3.50(400)
= $4,600
Special Price
Total Revenue
= $4(800) + $3.50(800)
= $6,000
C.
Yes. Note that:
Regular Price
Profit Contribution
= 0.25($8)(400) + (0.75)($3.50)(400)
= $1,850
Special Price
Profit Contribution
= 0.25($4)(800) + 0.75($3.50)(800)
= $2,900
49. Simultaneous Equations. Macrosoft, Inc., based in Seattle, Washington, manufactures a wide range of
parts for the aircraft, automotive, and agricultural equipment industries. The company is currently evaluating
the merits of building a new plant in order to fulfill a new contract with the federal government. The alternative
to expansion is to use additional overtime, reduce other production, or a combination of both. The company will
add new capacity only if the economy appears to be expanding. Forecasting the general economic activity of the
United States is therefore an important input to the decision making process. The firm has collected data and
estimated the following relations for the U. S. economy:
Last year's total profits (all corporations) Pt-1
= $1,200 billion
This year's government expenditures G
= $3,000 billion
Annual consumption expenditures C
= $800 billion + 0.75Y + u
Annual investment expenditures I
= $1,520 billion + 0.9Pt-1
Annual tax receipts T
= 0.2 GDP
National income Y
= GDP - T
Gross domestic product GDP
= C + I + G
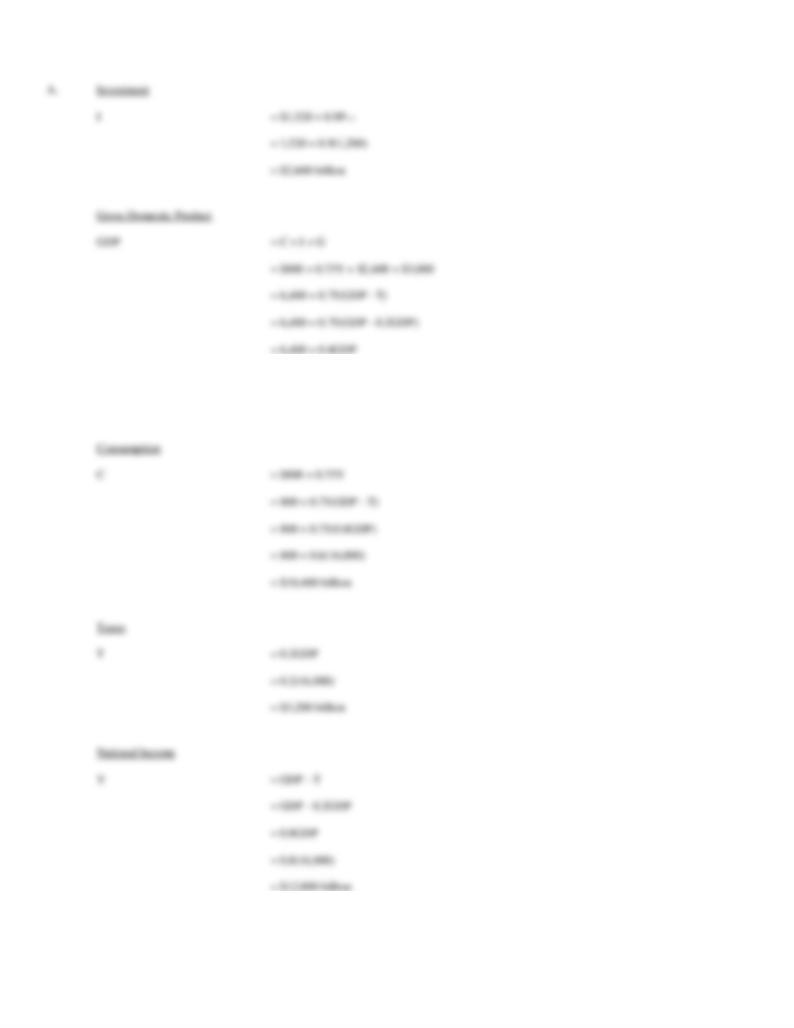
0.4GDP
= 6,400
GDP
= $16,000 billion

50. Simultaneous Equations. Gates Equipment, Inc., manufactures a wide range of parts for the agricultural
equipment industry. The company is currently evaluating the merits of building a new plant in order to fulfill a
new contract with a large export concern. The alternative to expansion is to use additional overtime, reduce
other production, or a combination of both. The company will add new capacity only if the regional economy
appears to be expanding. Forecasting the general economic activity of the United States is therefore an
important input to the decision making process. The firm has collected data and estimated the following
relations for the U. S. economy:
Last year's total profits (all corporations) Pt-1
= $1,400 billion
This year's government expenditures G
= $2,800 billion
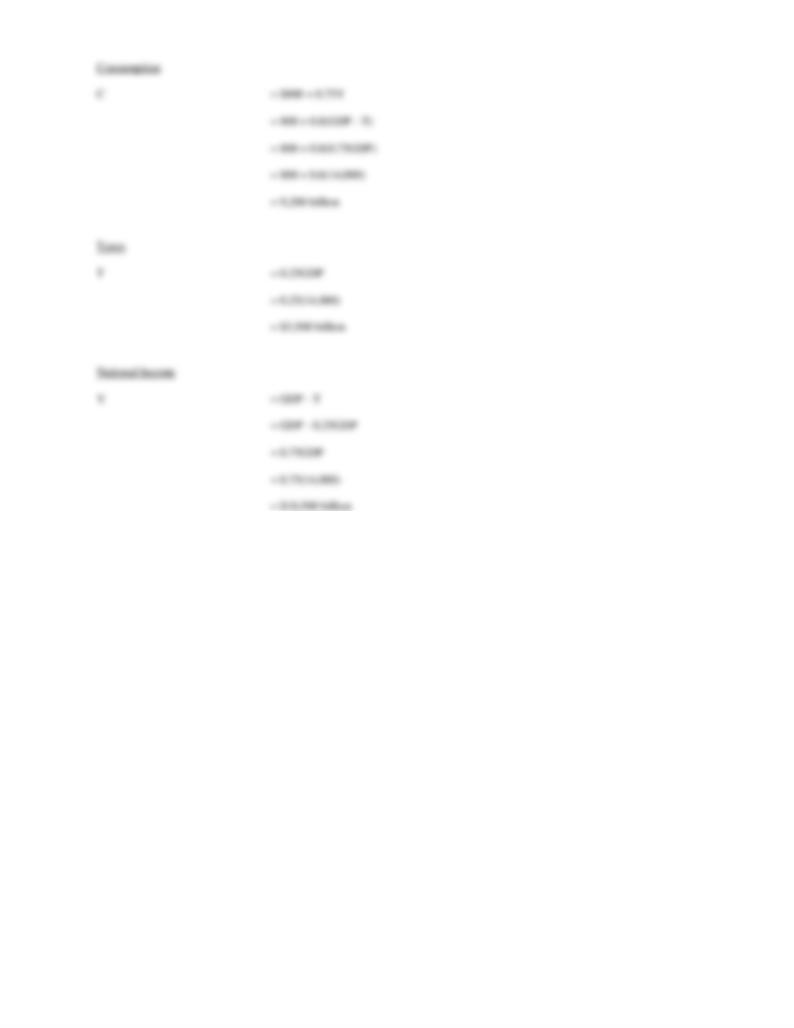
Annual consumption expenditures C
= $800 billion + 0.8Y + u
Annual investment expenditures I
= $950 billion + 0.75Pt-1
Annual tax receipts T
= 0.25 GDP
National income Y
= GDP - T
Gross domestic product GDP
= C + I + G
0.4GDP
= $5,600
GDP
= $14,000 billion